Current assets to equity ratio in Excel
Current assets to equity ratio reflect the level of liquidity of the financial assets which belongs to the enterprise. It shows a share of equity directed on current activity financing. This ratio is one of the indicators of the financial stability of the organization.
Current assets to equity ratio: criterion value
Recall that liquidity of financial resources is their ability to transform into other assets. The current assets to equity ratio show how much of the money supply (equity) is invested in working capital as the most maneuverable part of assets. That is, which part of the equity is "put into business" and aimed at production costs, inventory and other assets of a long liquidity period.
The formula for current assets to equity ratio is next:
Current assets to equity ratio (CATER) = net working capital / equity
Net working capital is the difference between the equity and non-current assets of the company.
The formula for the current assets to equity ratio using line codes from financial statement
How to rely on financial statements and to find the current assets to equity ratio? In this formula we use financial statement:
CATER = (code1300 - code1100) / code1300
The formula for calculating the indicator is transformed into the following form if the long-term liabilities of the company have a positive value:
(code1300 + code1400 - code1100) / code1300
An alternative option for estimating cater:
CATER = (code1200 - code1500) / code1300.
The recommended value of the ratio is 0.5 and higher. But a specific indicator should be compared with the industry average which is calculated as the arithmetic mean value. In each industry, there can be an optimal range. It makes sense to compare the enterprise coefficient with these figures.
Decreasing the ratio in the dynamics and negative value point at:
- the inability of the company to independently ensure the formation of costs and inventories;
- reduction of capital for the formation of non-current and current assets.
An increase in the coefficient above the norm indicates that:
- the ability to freely maneuver your financial resources;
- the growth of flexibility in the disposal of equity.
The higher the current assets to equity ratio, then the higher the solvency of the organization. But ultra-high values of the indicator can be observed with increasing long-term obligations because of which financial independence decreases.
Example of ratio calculation in Excel
In practice, it is customary to evaluate the ratio in dynamics. This is the only way to analyze the effectiveness of the management in working capital.
Let’s take the period of 2011-2015 for analysis. Let's select the lines that we will use to calculate the current assets to equity ratio:
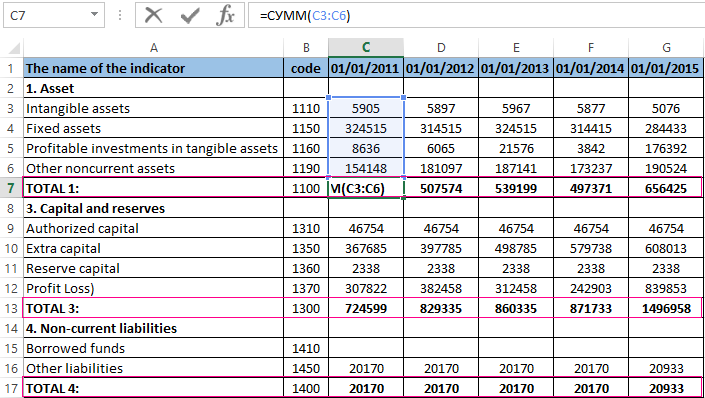
The calculation formula in Excel will look like this:
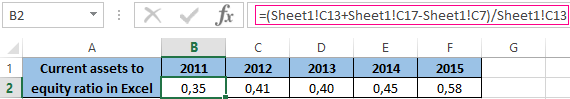
The indicator for the organization is below the normative level but not much. And there is a tendency to maintain stability for all 5 years. If you want more detailed analysis and making strategic decisions, it is necessary to look at the value of the coefficient for other companies operating in the same industry and other indicators of financial stability assessment.
Let's show in dynamics the ratio on the Excel chart:
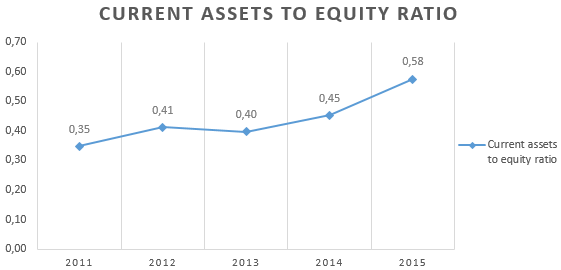
We note a slight increase in the indicator in the last two years. It is a positive factor. And it may indicate an increase in the company's solvency and financial independence including the ability to maintain its own working capital level and provide working capital from its own sources of financing.
