How to find Coefficient of Variation in Excel
The coefficient of variation in statistics is used to compare the spread of two random variables with different units relative to the expected value. As a result, you can get comparable results. The indicator clearly illustrates the homogeneity of the time range.
The coefficient of variation is also used by investors in portfolio analysis as a quantitative measure of the risk associated with investing in certain assets. Particularly it’s effective in situations when assets have different returns and a different risk level. For example, one asset has a high expected profitability, while the other has a low risk level.
How to calculate the coefficient of variation in Excel?
The coefficient of variation is the ratio of the root-mean-square deviation to the arithmetical mean. The following formula is used in the statistics for calculation:
CV = σ / ǩ,
- CV is the coefficient of variation;
- σ is root-mean-square deviation;
- ǩ is the arithmetic mean value of the variance of values.
The coefficient of variation allows you to compare the risk of investment and the profitability of two or more portfolios of assets. And the portfolios of assets may differ significantly. That is, the indicator links risk and profitability. It allows you to estimate the ratio between the root-mean-square deviation and the expected return in relative stating. Correspondingly you can compare the results.
It is necessary to take into account the following point making an investment decision: when the expected return on an asset is close to 0, so the coefficient of variation can turn out to be large. And the indicator changes significantly with a slight change in profitability.
There is no built-in function for calculating the coefficient of variation in Excel. But you can find the quotient of the root-mean-square deviation and the arithmetic mean. Let’s consider the example.
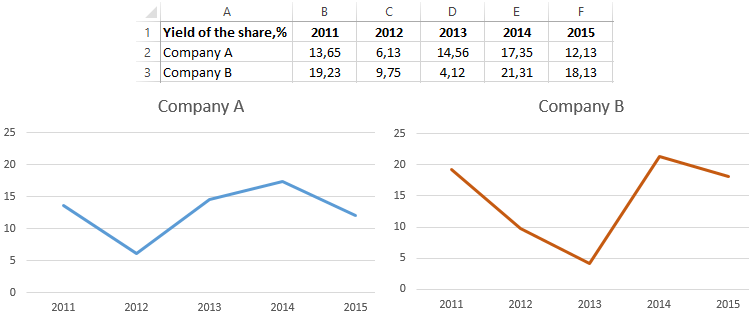
The yield of two securities in the previous five years. This can be demonstrated graphically:
Formula for calculating the coefficient of variation in Excel
Usually the indicator is expressed as a percentage. Therefore, a percentage format is set for the cells with results.
The value of the coefficient for company A is 33%, which indicates the relative homogeneity of the range.
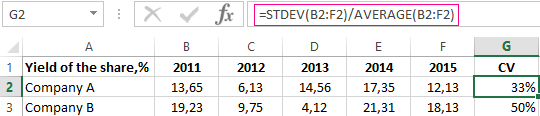
Now you have to compare: the coefficient of variation for company B was 50%: the range is not homogeneous and the data is significantly scattered relative to the arithmetic mean.
Interpretation of results
The financial analyst must justify his decision before adding an additional asset to the investment portfolio. One way is to calculate the coefficient of variation.
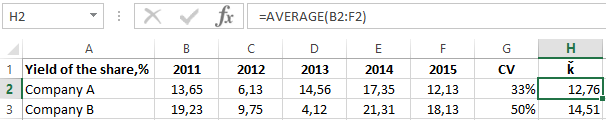
Expected return on securities will be:
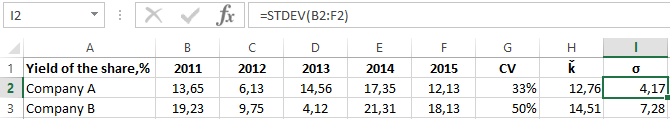
The root-mean-square deviation of profitability for the assets of company A and B is next:
Securities of company B have a higher expected yield. They exceed the expected profitability of company A by 1.14 times. But investing in the assets of the enterprise is riskier. The risk is 1.7 times higher. How to compare stocks with different expected returns and different levels of risk?
The coefficient of variation in yield is calculated to compare the assets of the two companies. The indicator for enterprise B is 50% and for enterprise A is 33%. The risk of investing in securities of firm B is 1.54 times higher (50% / 33%). This means that shares of company A have the best risk/yield ratio. Therefore, it is preferable to invest in shares of company A.
Thus, the coefficient of variation indicates the level of risk, which can be useful when you include a new asset in the portfolio. The indicator allows you to compare the expected profitability and risk. That is, you can compare dimensions with different units of measurement.
