Creating a database in Excel for customers with examples and templates
Many users are actively using Excel to generate reports for their subsequent editing. Reports are using for easy viewing of information and a complete control over data management during working with the program.
Table is the interface of the workspace of the program. A relational database structures the information in the rows and columns. Despite the fact that the standard package MS Office has a standalone application for creating and maintaining databases named Microsoft Access, users are actively using Microsoft Excel for the same purpose. After all program features allow you to: sort; format; filter; edit; organize and structure the information.
That is all that you need for working with databases. The only caveat: the Excel program is a versatile analytical tool that is more suitable for complex calculations, computations, sorting, and even for storage structured data, but in small amounts (no more than one million records in the same table, in the 2010 version).
Database Structure - Excel table
Database - a data set distributed in rows and columns for easily searching, organizing and editing. How to make the database in Excel?
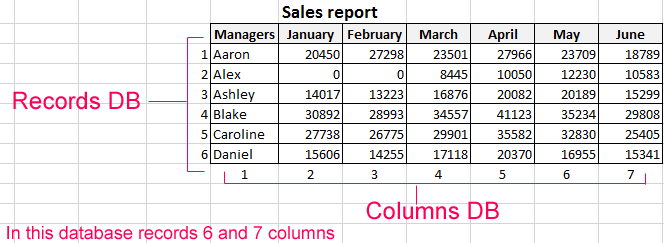
All information in the database is contained in the records and fields:
- Record is database (DB) line, which includes information about one object.
- Field is the column in the database that contains information of the same type about all objects.
- Records and database fields correspond to the rows and columns of a standard Microsoft Excel spreadsheet.
If you know how to do a simple table, then creating a database will not be difficult.
Creating DB in Excel: step by step instructions
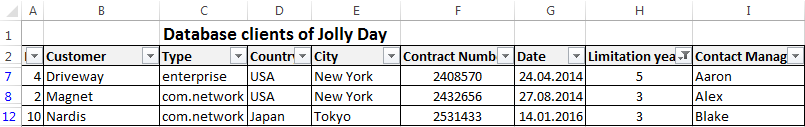
Step by step to create a database in Excel. Our challenge is to form a client database. For several years, the company has several dozens of regular customers. It is necessary to monitor the contract term, the areas of cooperation and to know contacts, data communications, etc.
How to create a customer database in Excel:
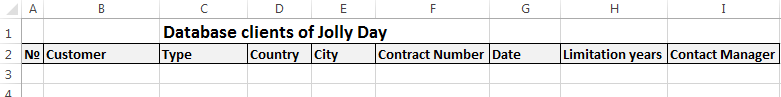
- Enter the name of the database field (column headings).
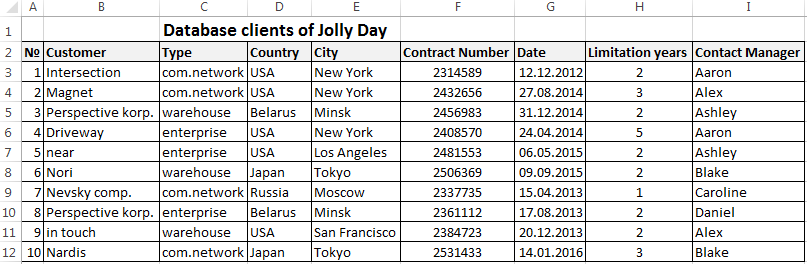
- Enter data into the database. We are keeping order in the format of the cells. If it is a numerical format so it should be the same numerical format in the entire column. Data are entered in the same way as in a simple table. If the data in a certain cell is the sum on the values of other cells, then create formula.
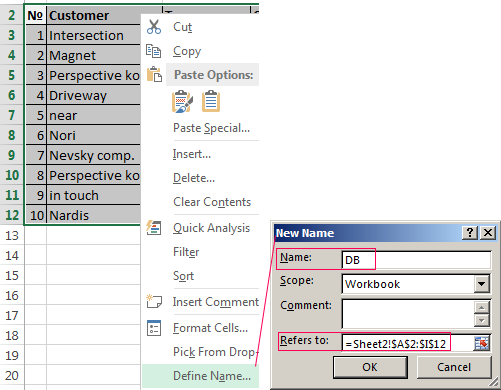
- To use the database turn to tools «DATA».
- Assign the name of the database. Select the range of data - from the first to the last cell. Right mouse button - the name of the band. We give any name. Example - DB. Check that the range was correct.
The main work of information entering into the DB is made. For easy using this information it is necessary to pick out the needful information, filter and sort the data.
How to maintain a database in Excel
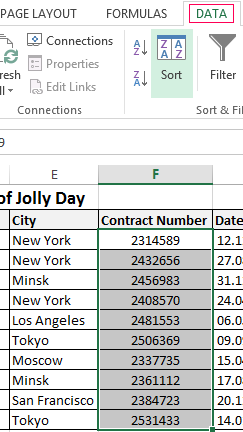
To simplify the search for data in the database, we’ll order them. Tool «Sort» is suitable for this purpose.
- Select the range you want to sort. For the purposes of our fictitious company the column «Date». Call the tool «Sort».
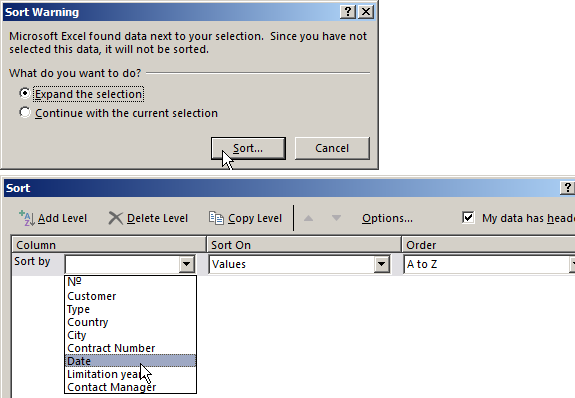
- Then system offers automatically expand the selected range. We agree. If we sort the data of only one column and the rest will leave in place so the information will be wrong. Then the menu will open parameters where we have to choose the options and sorting values.
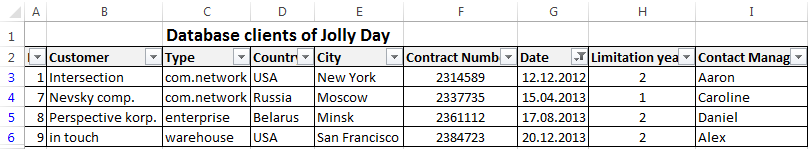
The data distributed in the table by the term of the contract.
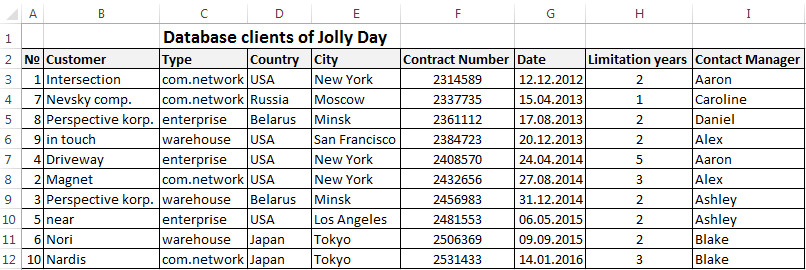
Now, the manager sees to whom it is time to renew the contract and with which companies we continue the partnership.
Database during the company's activity is growing to epic proportions. Finding the right information is getting harder. To find specific text or numbers you can use:
By simultaneously pressing Ctrl + F or Shift + F5. «Find and Replace» search box appears.
Filtering the data
By filtering the data the program hides all the unnecessary information that user does not need. Data is in the table, but invisible. At any time, data can be recovered.
There are 2 filters which are often used In Excel:
- AutoFilter;
- filter on the selected range.
AutoFilter offers the user the option to choose from a pre-filtering list.
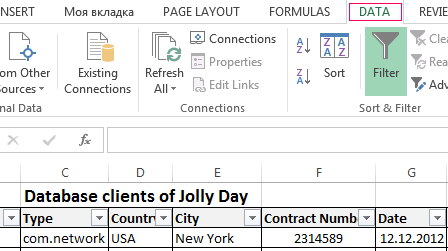
- On the «DATA» tab, click the button «Filter».
- Down arrows are appearing after clicking in the header of the table. They signal the inclusion of "AutoFilter".
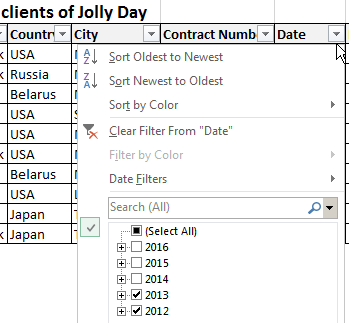
- Click on the desired column direction to select a filter setting. In the drop-down list appears all the contents of the field. If you want to hide some elements reset the birds in front of them.
- Press "OK". In the example we hide clients who have concluded contracts in the past and the current year.
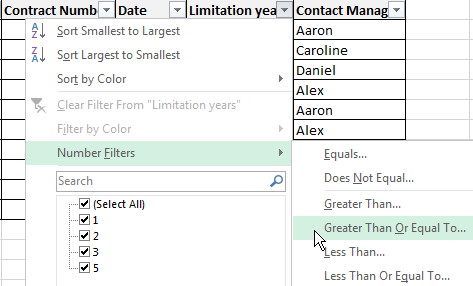
- To set a condition to filter the field type «Greater Than», «Less Than», «Equals», etc. values, select the command «Number Filters» in the filter list.
- If we want to see clients in a customer table whom we signed a contract for 3 years or more, enter the appropriate values in the AutoFilter menu.
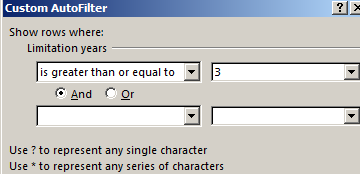
Done!
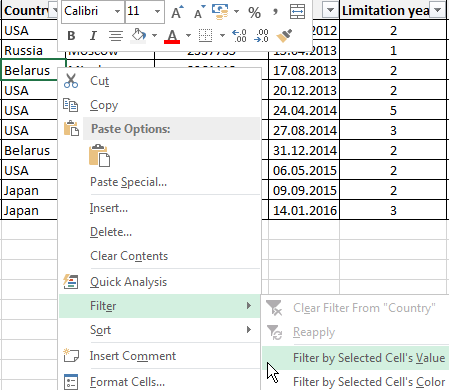
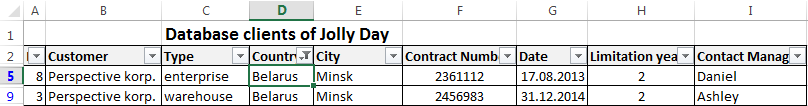
Let’s experiment with the values filtered by the selected cells. For example, we need to leave the table only with those companies that operate in Belarus.
- Select the data with information which should remain prominent in the database. In our case, we find the column country - "РБ ". We click on the cell with right-click.
- Perform a sequence command: «Filter»–«Filter by Selected Cell’s Value». Done.
Sum can be found using different parameters if the database contains financial information:
- the sum of (summarize data);
- count (count the number of cells with numerical data);
- average (arithmetic mean count);
- maximum and minimum values in the selected range;
- product (the result of multiplying the data);
- standard deviation and variance of the sample.
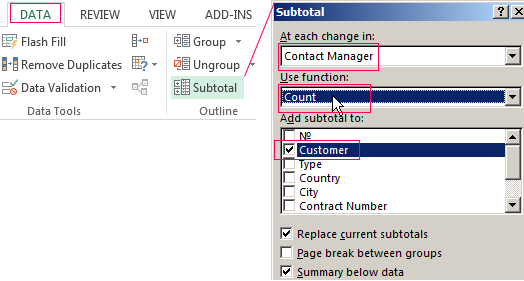
Using the financial information in the database:
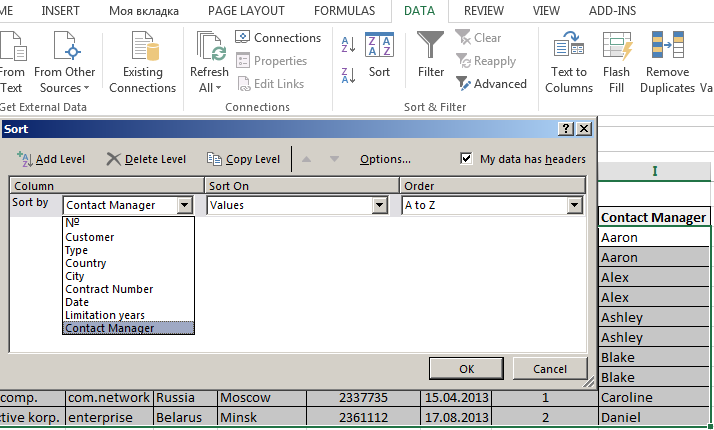
- Then the menu will open parameters where we have to choose the options and sorting values «Contact Manager».
- Select the database range. Go to the tab «DATA» - «Subtotal».
- Select the calculation settings In the dialog box.
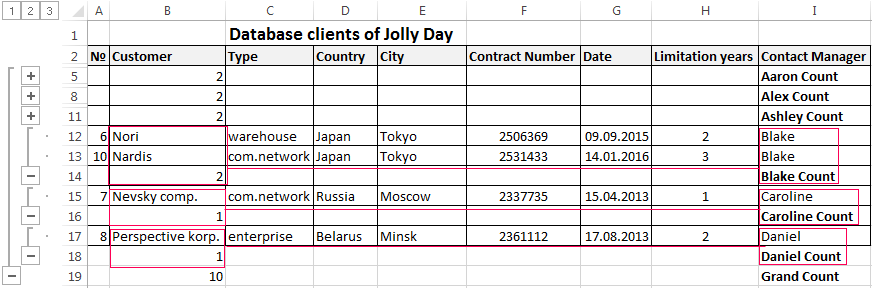
Tools on the «DATA» tab allows to segment the DB. Sort information in terms with relevance to company goals. Isolation of purchasers of goods groups help to promote the marketing of the product.
Prepared sample templates for conducting client base segment:
- Template for manager which allows monitors the result of outgoing calls to customers download.
- The simplest template. Customer in Excel free template database download.
- Example database from this article download example.
Templates can be adjusted for your needs: reduce, expand, and edit.
