Random number generator Excel in functions and data analysis
We have got a sequence of numbers consisting of virtually independent elements that obey a certain counting distribution. As a rule, it's a uniform distribution.
There are different ways to generate random numbers in Excel. Let's view the best of them.
Random Number Function In Excel
- The function RAND() returns a random real number of a uniform distribution. It will be less than 1, and greater than or equal to 0.
- The function RANDBETWEEN returns a random integer number.
Let's view some examples of their practical application.
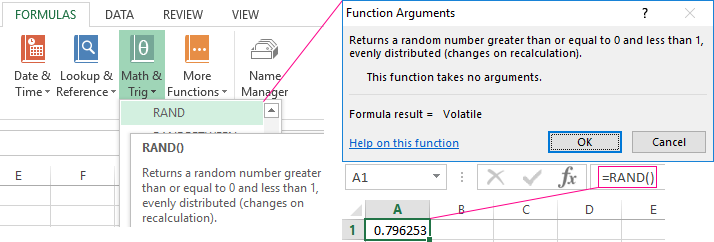
Selection of random numbers using RAND
This function doesn't require arguments.
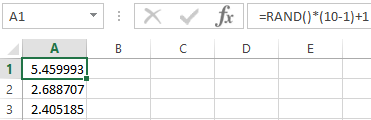
For example, to generate a random real number in the range 1 to 10, use the following formula: =RAND()*(5-1)+1.
The returned random number is distributed uniformly on the interval [1,10].
Each time the sheet is calculated or the value is changed in any cell within the sheet, a new random number is returned. If you want to save the generated set of numbers, replace the formula with its value.
- Click on the cell containing the random number.
- Select the formula in the formula bar.
- Press F9. Then Enter.
Let us check the uniformity of distribution of the random numbers from the first selection using a distribution bar chart.
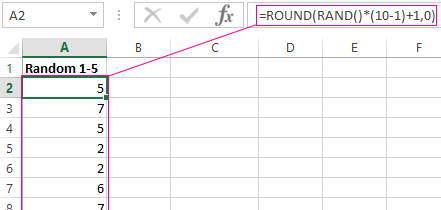
- We round the values that the function =RAND() returns. To do this, we use the function: =ROUND().And fill this formula with the big range: A2:A201.
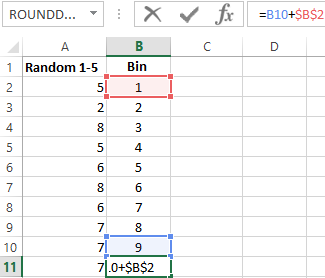
- Form the ranges to contain the values (bin). The first such range is 0-0.1. For the subsequent ones use the formula =B2+$B$2.
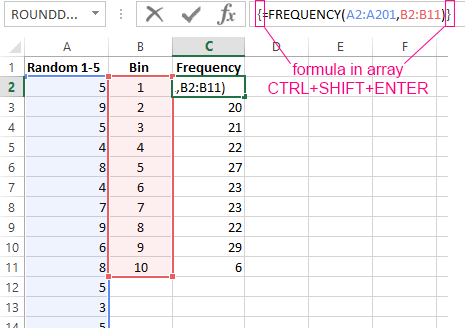
- Determine the frequency of random numbers in range A2:A201. In cell C2 use the array formula: After input formula, select range C2:C11, press key F2 and press hot keys: CTRL+SHIFT+ENTER. We will execute the formula in the array Excel.
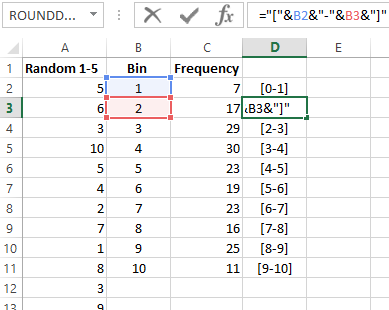
- Form the ranges with the use of the concatenation character (="[0,0-"&C2&"]").
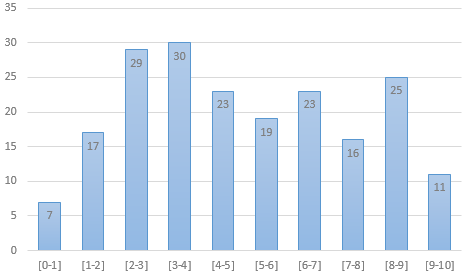
- Build a distribution bar chart for the 200 values obtained with the use of the RAND() function.
The vertical values represent the frequency. The horizontal ones represent the ranges.
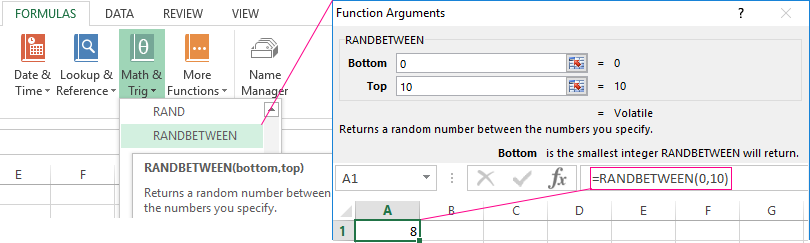
RANDBETWEEN function
The syntax of the RANDBETWEEN function is as follows: (lower limit; upper limit). The first argument must be less than the second. Otherwise, the function will return an error. It is assumed that the limits are integers. The formula discards the fractional part.
An example of the function's application:
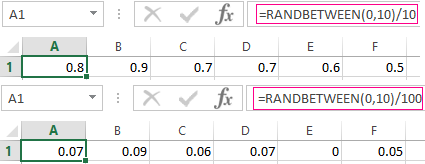
Random numbers with an accuracy of 0.1 and 0.01:
How To Create Random Number Generator In Excel
Let's create a random number generator that generates values from a certain range. Use a formula of the following form:
The formula randomly selects any of the numbers in the range A1:A10.
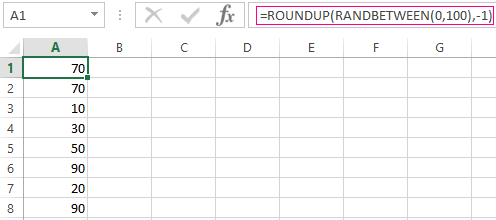
Let's create a random number generator in the range 0-100, with a step of 10.
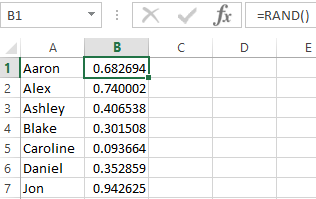
It's required to select 2 random text values from the list. Using the RAND() function, let's match the text values in the range A1:A7 with random numbers.
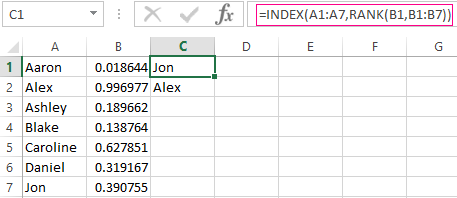
Use the =INDEX function to select two random text values from the initial list.
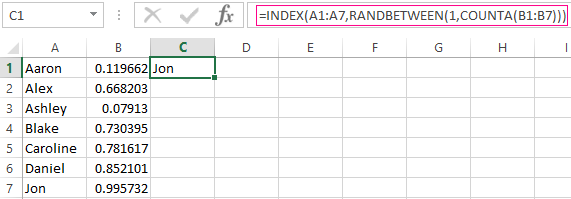
To select one random value from the list, apply the following formula:
Generator Of Standard Distribution Random Numbers
The RAND and RANDBETWEEN functions return random numbers with a single distribution. There's an equal probability for any value to fall into the lower or upper limit of the requested range. The variation of the target value turns out to be huge.
A standard distribution means most of the generated numbers are close to the target number. Let's adjust the RANDBETWEEN formula and create an array of data with a standard distribution.
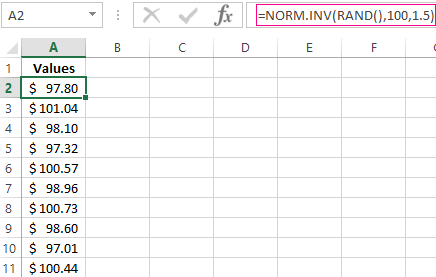
The prime cost of the X product is $100. The entire batch is subject to a standard distribution. The random variable also obeys a standard probability distribution.
Under such conditions, the average value of the range is $100. Let's generate an array and build a chart that obeys a standard distribution with a standard deviation of $1.5.
Use the function:
Excel calculates the values in the range of probabilities. As the probability of manufacturing a product with a prime cost of $100 is maximal, the formula returns values that are close to 100 more often than other values.
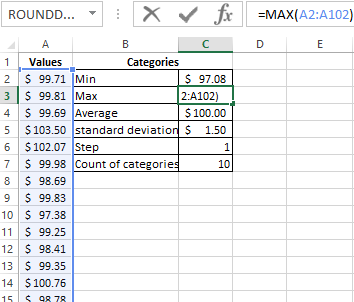
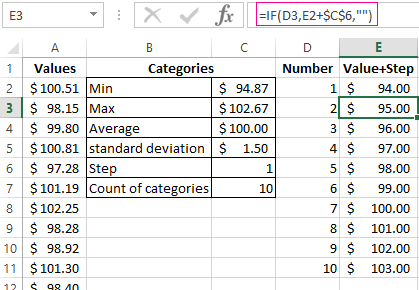
Let's proceed to building the chart. First of all, you need to create a table containing the categories. To do this, split the array into periods:
- Determine the minimum and maximum values in the range using the =MIN(A2:102) and =MAX(A2:102) functions.
- Indicate the value of each period or step. In our example, it's equal to 1.
- The number of categories is 10.
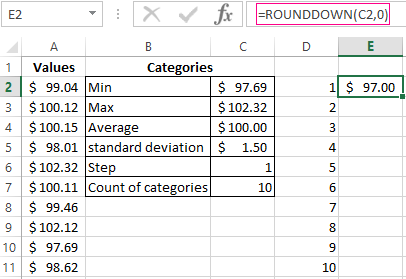
- The lower limit of the table containing the categories is the nearest multiple number rounded down. Enter the formula =ROUNDDOWN(C2,0) into the E1 cell.
- In the E2 cell and below, the formula will look as follows: That is, each subsequent value is increased by the specified step size.
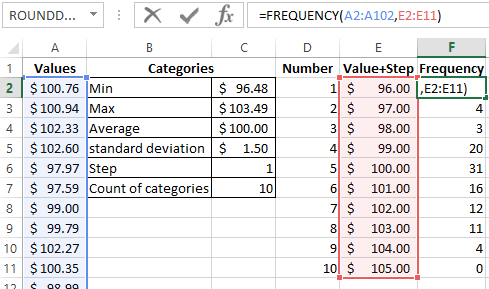
- Let's calculate the number of variables in the given interval. Use the function: The formula will look as follows:
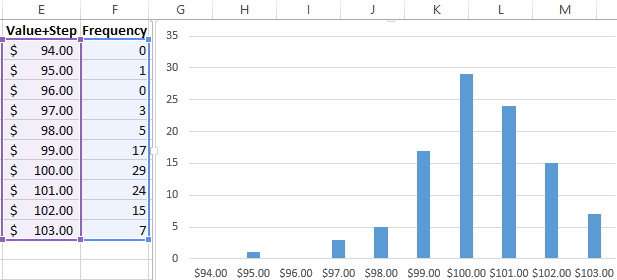
Based on the obtained data, we can build a chart with a normal distribution. The value axis represents the number of variables in the interval; the category axis represents the periods.
A chart with a normal distribution is built. As it should be, its shape resembles a bell.
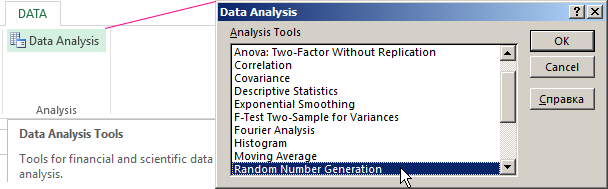
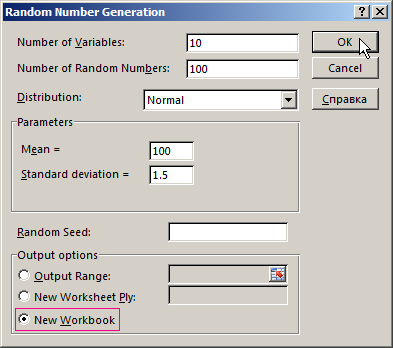
There's a much simpler way to do the same with the help of the «Data Analysis» package. Select «Random Number Generation».
Click here to learn how to set up the standard feature: «Data Analysis».
Fill in the generation parameters. Set the distribution as «Normal».
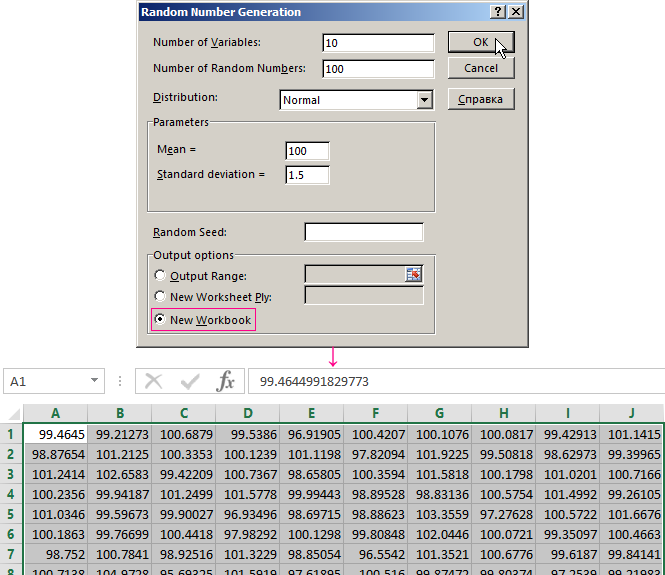
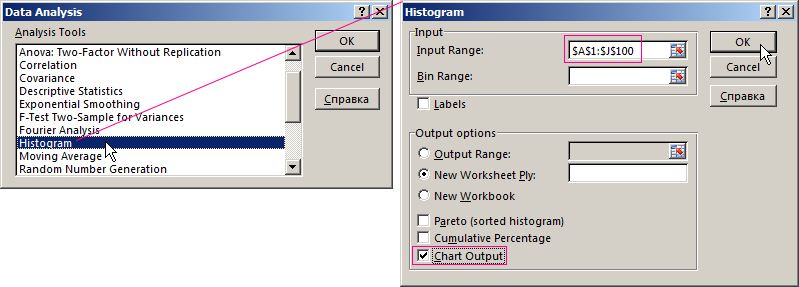
Click OK. It gives us a set of random numbers. Open the «Data Analysis» once again. Select «Histogram». Configure the parameters. Be sure to check the «Chart Output» box.
The obtained result is as follows:
Download random number generators in Excel
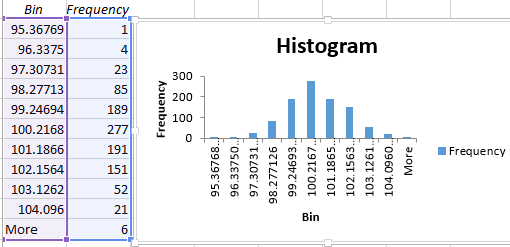
An Excel chart with a standard distribution has been built.
