How to create a sales plan in Excel with a forecast graph
Financial planning of any trading enterprise is impossible without a sales budget. The maximum exactness and accuracy of calculations is the key to the successful organization of the work of all structural units. Planned indicators are determined for each product line, for each branch, shop and direction, for each manager (if there is such a necessity). Consider how to make a sales target for a month in Excel.
The example of making a sales target for a month
We have a developing company that systematically maintains financial statements. The implementation is affected by such indicator as a seasonality. We will forecast sales for future periods.
History for the last year:
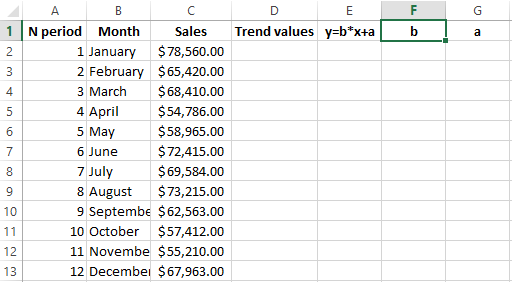
The monthly sales budget will be more accurate if the more actual data is taken for analysis. Therefore, we took the figures for 12 previous periods (months).
As the company is developing, a linear trend can be used to forecast sales. The mathematical equation: y = b * x + a.
- Y is sales;
- X is the serial number of the period;
- A is the minimum limit;
- B is the increase of each next value in the time series.
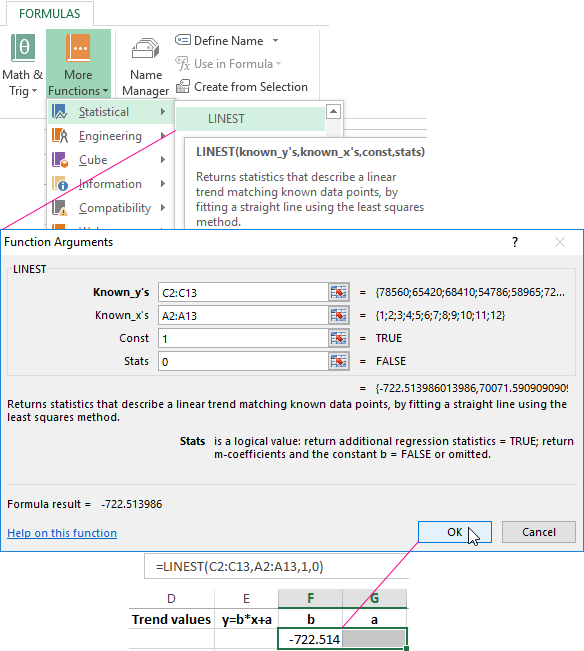
The value of the linear trend in Excel is calculated using the =LINEST() function. We compose a table to determine the coefficients of the equation (y and x are already known to us).
A combination of SHIFT + F3 opens a window «Insert Function» or selected: «FORMULAS»-«More Functions»-«Statistical»-«LINEST». We fill:
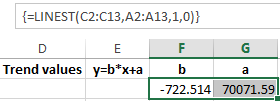
We select at once 2 cells: F2 and G2 (the values of the arguments b and a). Active cell should be a formula. Press F2, and then Ctrl + Shift + Enter. We obtain values for the unknown coefficients of the equation:
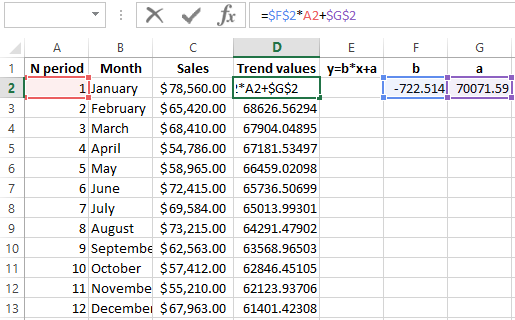
Let us find the value y for each period of the analyzed domain. We substitute the calculated coefficients in the equation.
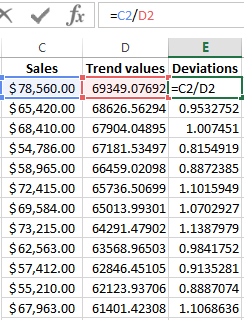
The next step is the calculation of the deviations of actual sales values from the values of the linear trend:
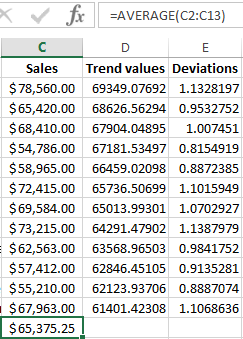
This value is necessary for us to calculate seasonality. Next, we find the average implementation rate for all periods using the =AVERAGE(C2:C13) function.
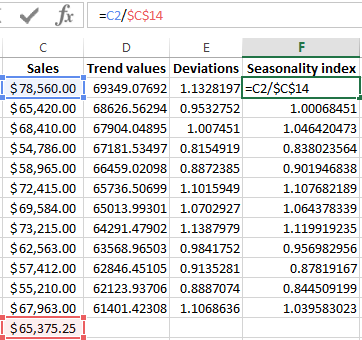
We calculate the seasonality index for each period. Calculation formula: sales / the average sales.
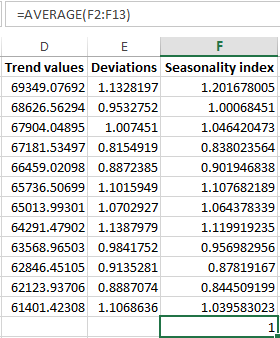
Using the =AVERAGE(F2:F13) function, we find the general seasonality index:
We will predict the level of sales for the next month. We take into account the growth in sales amount and seasonality.
First find the value of the trend for the future period. To do this, in the column with the number of periods, add the number 13 - the new month. We will extend the formula in the «Trend Values» column one cell down:
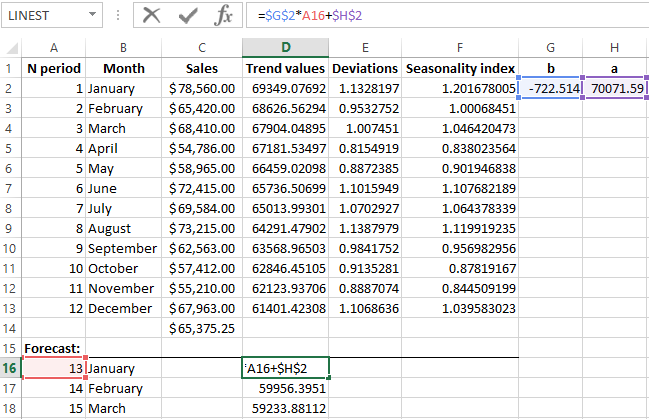
We multiply the trend value by the seasonality index of the corresponding month (in the example, "January"). We obtain the calculated the sales amount of goods for a new period:
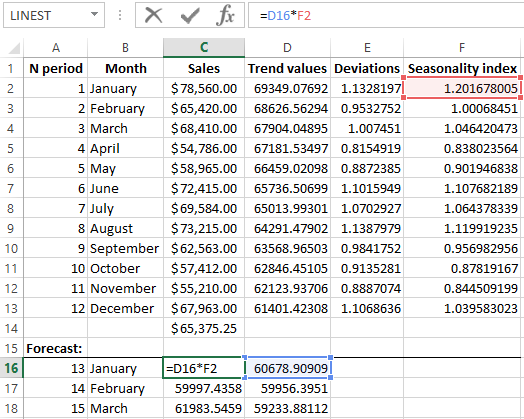
By the same principle, it is possible to forecast the implementation for 2, 3, 4 and subsequent months.
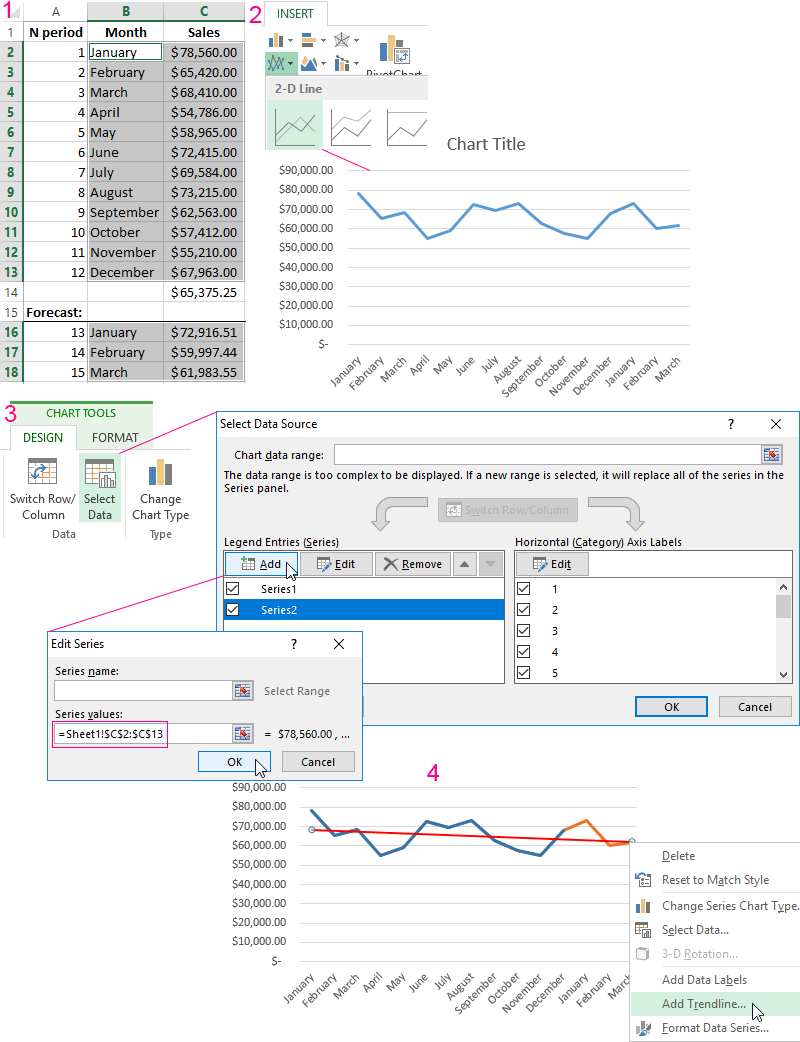
The forecast diagram with the trend line:
When building a financial realization plan, the concept of "cross-section" is used. This is the detailed elaboration of the plan in a certain "cut": by time, by sales channels, by buyers (customers), by commodity groups, by managers. This detailing allows you to check the realism of the forecast and later on it helps to verify the implementation.
Analysis of implementation of sales plan in Excel
For each heading, data is collected on actual sales for the period (per month, as a rule). Our sample table is elementary. But at the enterprise it makes sense to distribute products to commodity positions, to result in articles, selling in pieces. For a more detailed analysis - specify the cost, calculate profitability and profit.
Analysis of the implementation of the plan for positions allows you to compare the current indicators with the preceding and with the planned. If a sharp change occurred at some site, a more detailed study of the direction is required.
When the statistical data is entered and formalized, it is necessary to evaluate the fulfillment of the plan for the commodity items. The comparison table might look like this:
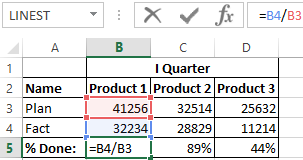
To calculate the percentage of plan execution, you need to divide the actual indicators into planned ones, set the percentage format for cells in Excel.
