Beautiful simple interactive line chart in Excel
An interactive line chart allows you to highlight selected data ranges so you can quickly identify factors that influence changes in performance. Clean and attractive dashboard visualization makes analysis enjoyable and effective. The ability to switch ranges and categories gives you flexibility when working with reports.
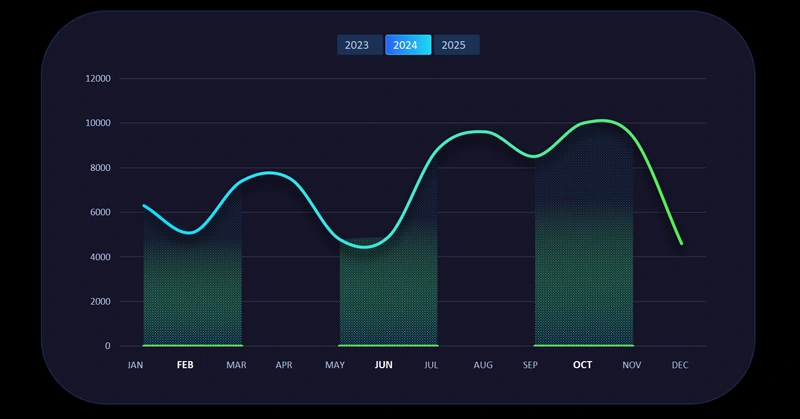
Interactive Line Chart Template with Cursor in Excel
If you need to find growth points in the history of data changes, the interactive features of a line chart will be useful. By holding the Control key on your keyboard, you can select multiple periods on the same visualization block. These functions are built into Excel, so you will not need any VBA macros. To see how it works, download the ready-made template at the end of the article. You can also create such a chart yourself by following the step-by-step video tutorial. In the video you will learn how to:
- Create a standard line chart in Excel.
- Change the chart type for the "Fill" data series.
- Change the chart type again to 2D Area for "Fill2."
- Create the foundation for the visualization block design.
- Customize the design and color palette of the interactive line chart.
- Use a patterned fill for the lower cursor layer.
- Use a semi-transparent gradient fill for the top cursor layer.
- Control the line chart using pivot table slicers.
- Customize the slicer design style.
- Enjoy the data highlighting capabilities with the cursor.
This interactive data visualization is typically used together with other analytical tools on dashboards. For example:

Dashboard template for analyzing investment portfolio assets in Excel
A beautiful interactive line chart in Excel makes data analysis clear and predictable. It improves dashboard structure and helps you quickly find important trends. Use this approach to make your reports look professional and provide real decision-making value.
Download the beautiful simple interactive line chart in Excel 

Data Visualization Charts for Interactive Report Creation in Excel.
Dashboard Templates