Budget-spending gauge and rate comparison in Excel
Gas and electricity can be consumed in the exact same volume of kilowatt-hours — yet cost completely different amounts. This gap between physical volume and monetary equivalent is exactly what most often stays outside of management's attention. The budget control block on a bakery's Excel dashboard closes that gap: a single screen shows both the comparative cost of energy sources and the current remaining budget on a gauge indicator — so financial standing can be read in a second, not after five minutes of working through spreadsheets.
Interactive dashboard for analyzing the consumption of two types of energy
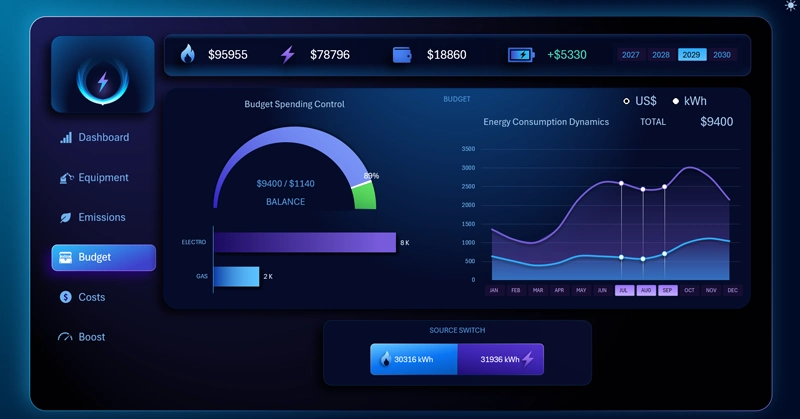
The budget control block on a bakery's Excel dashboard: comparing gas and electricity cost in USD at equal kWh volumes, a remaining-budget gauge that accounts for the credit reserve, and automatic recalculation when a source is turned off.
When the gauge needle moves into the red zone: how the credit reserve and remaining budget are shown at the same time — and what that means for running the bakery.
Features of the energy-spending budget control block:
- A line chart tracking the changing dynamics of gas and electricity cost in USD at identical kWh volumes (on the left).
- A budget-spending gauge with labels for the absolute remaining balance and the amount of credit funds drawn on (on the right).
- When any source is switched off, both elements recalculate down to zero for the excluded item.
This template is intended as a fragment for learning how to build such things, but you can also use the full version of the energy dashboard:

Excel dashboard for managing bakery energy spending
The budget control block is the bakery's financial control panel on a single screen. The rate-comparison bar chart answers the question "why so much?", while the remaining-budget gauge answers "how much is left, and will it last until the end of the month?" The credit reserve here isn't a hidden line in a table, but an explicit mark on the scale — you can see right away whether the business is running on its own funds or already drawing on its financial buffer. Being able to turn off any energy source and instantly zero out its contribution to the budget turns this block from a static report into a living scenario-planning tool: what happens to the balance if gas is dropped tomorrow?
 Download the template with the budget-spending gauge chart in Excel

Data Visualization Charts for Interactive Report Creation in Excel.
Dashboard Templates