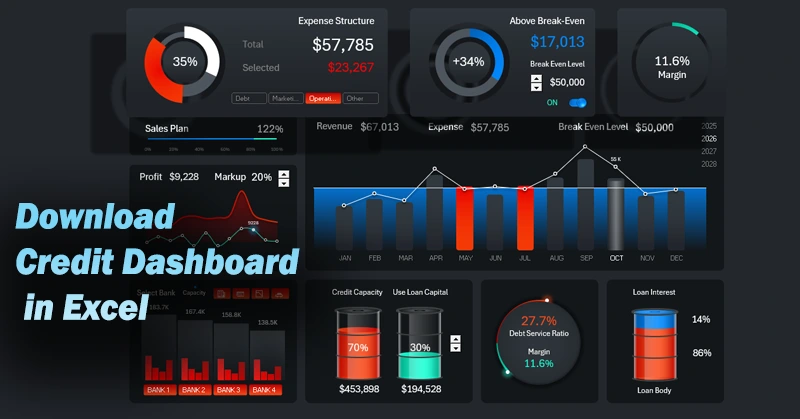
Download Excel Dashboard for Credit Impact on Business
Credit is a growth tool, but in small business, it can either help or harm. It’s important to evaluate the consequences of borrowing before making decisions. This article presents an Excel dashboard that helps visually analyze how loans impact profitability, expenses, and the overall financial stability of a business. The template is suitable for business owners and financial specialists who are looking for a simple and clear way to perform such analysis.
Excel Dashboard Template for Assessing the Impact of Credit on a Business
Using an Excel dashboard allows small businesses to assess in advance how safe and beneficial a new loan might be. This approach helps to:
- Evaluate the potential for scaling a small business through bank loans.
- Avoid cash flow gaps.
- Reduce the risks associated with borrowed capital.
- Preserve margins and make the business more resilient to financial risks.
- Prepare a creditworthiness report presentation to attract capital.
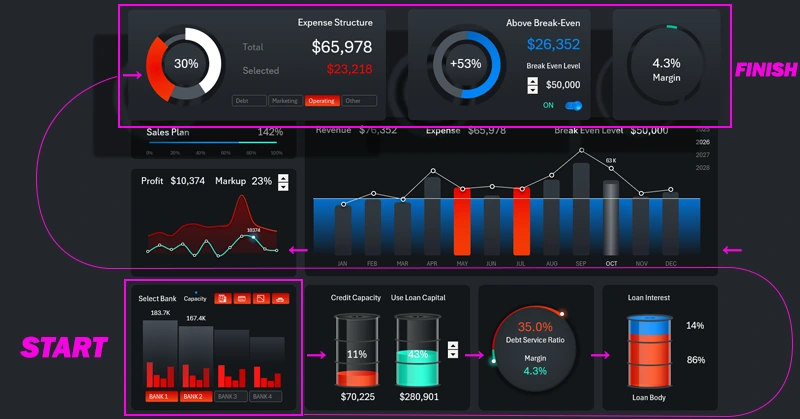
Every business is unique, and it's impossible to create a one-size-fits-all dashboard. But if you master the development of such interactive Excel report templates, you’ll be able to adapt this template to your own business. Review the step-by-step video tutorial on building a business loan analysis dashboard in Excel:
- Starting the dashboard development to analyze the profitability of small business loans in Excel.
- Processing raw data using pivot tables.
- Creating interactive dashboard controls using slicer buttons.
- Example of creating additional controls using developer tools.
- Formula table for interactive visualization of the share of borrowed capital used.
- Vertical bar chart template to create infographic animation titled "Credit as fuel for small business."
- Creating a graphical indicator to monitor the interest-to-principal ratio on the dashboard.
- Formulas to calculate credit burden and margin.
- How to design a stylish and functional pie chart in Excel.
- Formulas for dynamic data extraction from pivot tables.
- How to present 3 types of indicators on a single combined Excel chart with attractive design.
- Preparing the raw data for an interactive chart comparing revenue to different expense categories.
- Combined chart template to analyze revenue against any type of expense in Excel.
- How to create a progress bar for tracking sales plan performance and show overachievement beyond 100% in Excel.
- Example of using PowerPoint editing features to help design dashboards in Excel.
- Creating a dashboard header with unique graphical design for Excel presentation.
- Interactive expense structure chart with a cursor to highlight selected data.
- Visualization block for analyzing the average annual return level of a small business.
- How to design a stylish custom button for the Excel dashboard interface.
- Formula and chart for a positive or negative marginal income value.
- Two-level combined chart for assessing small business creditworthiness across different banks — see the next video.
We strongly recommend reviewing the instructions on how to use this dashboard:
How the Excel Dashboard Helps Assess Small Business Credit Load
By using data visualizations and automated calculations, the Excel dashboard becomes a reliable tool for making informed decisions.


Data Visualization Charts for Interactive Report Creation in Excel.
Dashboard Templates