Dynamic Tables and Charts for CRM Dashboard in Excel
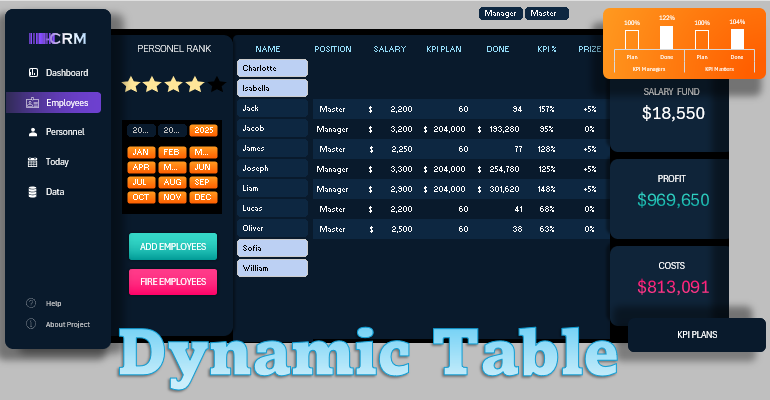
Master the art of creating dynamic tables and charts for a CRM dashboard in Excel using only built-in tools. This video tutorial will teach you how to automate processes with formulas, pivot tables, and slicers for real-time data analysis. No macros required!
How to Create Dynamic Tables and Charts in Excel

Create interactive CRM dashboards in Excel without using macros.
Video Tutorial Highlights:
- Building the layout for a CRM dashboard screen.
- Starting with dynamic tables by creating column headers.
- How to automatically shade every other row in a table using conditional formatting in Excel.
- Creating pivot and structured tables to organize and manage source data.
- Building a formula table to manage the dynamic table.
- Populating the dynamic table body with formulas.
- Adding dynamic table controls using pivot table slicers.
- How to create a five-star rating chart in MS Excel.
- Using the "Combine" tool in MS PowerPoint’s Shape Editor.
- Adding new controls for accounting periods to filter data by years and months.
- Example of managing a dynamic table on the CRM dashboard screen in Excel.
- How to add new rows to the dynamic table and new employees to the CRM system.
- How to delete rows from the dynamic table or remove employees from the CRM system.
- Creating a pivot bar chart for quick KPI analysis.
- Building a dynamic KPI ranking chart for detailed analysis.
- Showcasing the capabilities of dynamic tables and charts on the CRM dashboard.
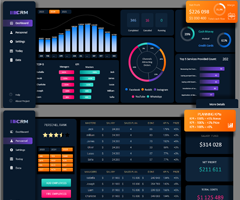
This video tutorial presents just one screen of a multifunctional CRM system dashboard built in Excel.

Use formulas, pivot tables, and slicers to build an interactive, real-time data visualization tool. Download the free template now!

