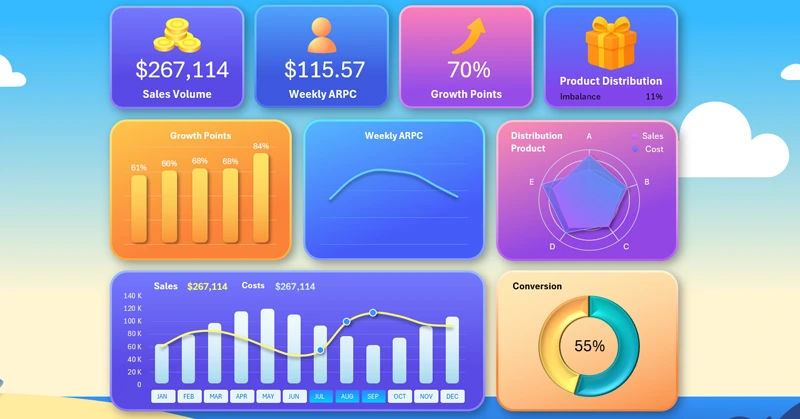
Excel Sales report with game-inspired visualization design
Gamification makes working with data in Excel more engaging and motivating. Thanks to game elements and an unconventional design, a regular report turns into a tool you want to use again and again. This dashboard example shows how you can combine analytics and game design mechanics to increase engagement in the sales analysis process.
Example of a dashboard with game-inspired and engaging design
What if you add gamification to Excel reports?
This is an example of trying to make work processes more engaging through aesthetic enjoyment, like in a game. You can download the ready-made template at the end of the article and adapt it to your needs. If you want to learn how to create such reports in Excel yourself, here is a step-by-step development guide where you will learn how to:
- Create a game world design as the background of a dashboard in Excel.
- Draw a cloud in Excel using shapes.
- Draw a starry dawn sky in Excel.
- Create game-inspired design in Excel.
- Set up a dashboard grid for gamifying a sales report in Excel.
- Create pivot tables to process statistical source data.
- Make the dashboard interactive using Excel pivot table slicers.
- Use the GETPIVOTDATA function for dynamic extraction of source values from pivot tables.
- Create an attractive combined bar chart with a line graph in Excel.
- Design new button blocks for dashboard slicers.
- Design an eye-catching donut chart using 3D effect settings in Excel.
- Create a visualization block for assessing growth point efficiency to guide business efforts.
- Design a bar chart with rounded column corners in Excel.
- Create a line chart showing the dynamics of changes in the average weekly income per customer.
- Create a visualization block to analyze the distribution of implementation and sales expenses by product category on a radar chart.
- Create circular grid lines for a radar chart in Excel.
- Design KPI dashboard cards and add dynamic labels for final metric values.
- Prepare a dashboard presentation for gamifying sales reports in Excel.
Description of the dashboard template structure with a game-inspired design:
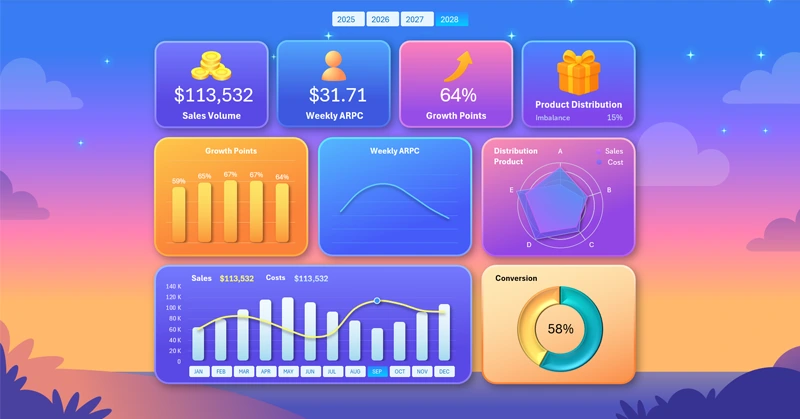
Sales dashboard in Excel with gamification for engaging analysis
Interactive report with gamification elements helps not only to analyze sales but also to maintain interest in working with numbers. This approach is useful for teams where it is important to encourage employees to use analytical tools regularly.
Download Excel Sales report with game-inspired visualization design

Data Visualization Charts for Interactive Report Creation in Excel.
Dashboard Templates