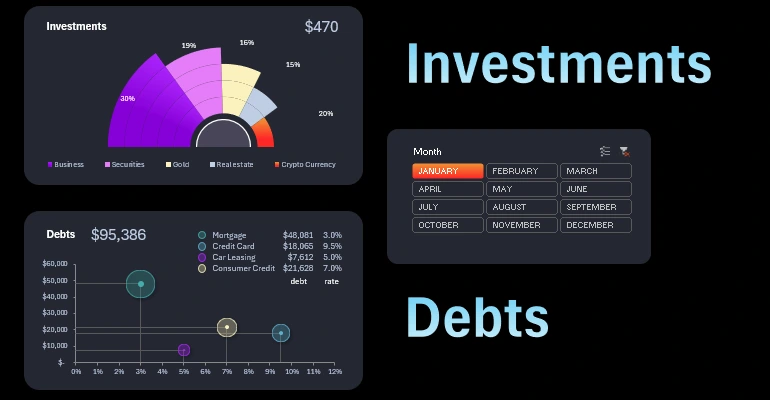
Investment vs Debt Report Excel Presentation Template
Creating an investment and debt report presentation in Excel is a key skill for financial management and for presenting data to investors or management. In this video tutorial, we will guide you step-by-step on how to compile the report, structure financial information, and visualize it using charts and graphs.
Create an Investment and Debt Comparison Report in Excel
In this tutorial, you will learn:
- How to create a pivot table for dynamic charts.
- Setting up formulas to process raw data.
- Creating a multi-level chart template.
- Formulas for building a debt presentation.
- An example of creating a stylish bubble chart in Excel.
- A button panel for dashboard management in Excel.
- Testing the functionality of the interactive presentation.
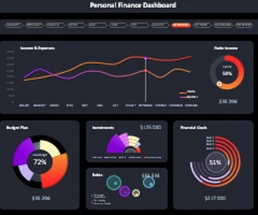
Download the full version of the dashboard with this chart template for managing personal financial records in Excel.
Our tips will help make your report more visual and convincing by leveraging Excel’s capabilities for data analysis visualization.
Download template for investment vs debt comparison report presentation in Excel 
Excel Dashboard Templates for Business

Data Visualization Charts for Interactive Report Creation in Excel.
Dashboard Templates