DOWNLOAD Sales Funnel Chart in Excel Download Example
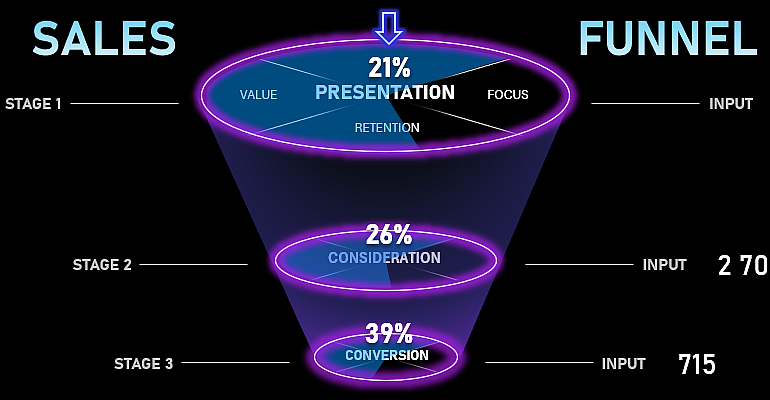
Want to learn how to quickly create a stylish sales funnel chart in Excel for report presentations? This video guide will show you how to turn raw sales data into meaningful, interactive visualizations. With simple instructions and professional tips, you’ll learn how to develop combined charts for analyzing sales funnel metrics. As a result, your presentation will clearly visualize the report and leave a lasting impression on your audience.
Video Guide on Building a Sales Funnel in Excel from Charts and Shapes

This tutorial contains step-by-step instructions to help you track sales performance effectively.
This tutorial covers the following topics:
- Setting up source data on conversion statistics for different strategies.
- Formulas for building a sales funnel in Excel.
- Creating a chart for the first stage of the funnel.
- Example of how to create a futuristic design for a 3D chart in Excel.
- Creating complex shapes for the chart design using MS PowerPoint.
- How to make interactive buttons for managing data on the dashboard in Excel.
- Styling the presentation with dynamic data labels.
- Presenting the sales funnel with a futuristic design in Excel.
Whether you’re working on a report, dashboard, or presentation, mastering Excel’s built-in tools will improve your analysis effectiveness and enhance decision-making processes.

