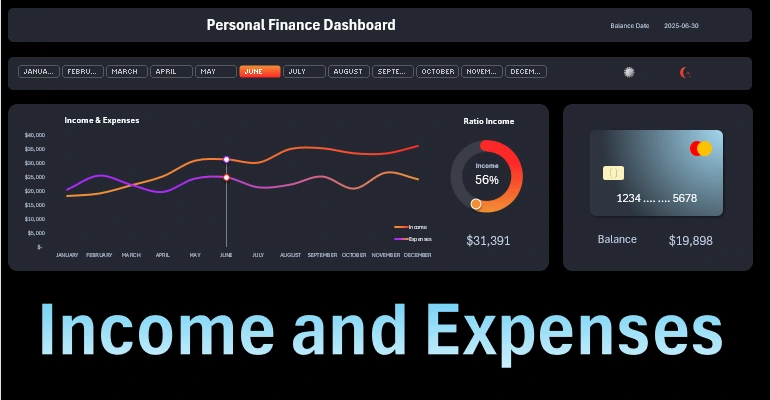
Interactive Income and Expense Chart in Excel
In this tutorial, you'll learn simple techniques for visualizing financial data, as well as adding filters and buttons to manage dynamic charts in Excel, enabling you to track key trends and make informed decisions.
Design an Interactive Income and Expense Chart in Excel
From this tutorial, you'll learn:
- Creating a dashboard design grid.
- Preparing source data and pivot tables for interactive charts.
- Line chart for monthly expenses in Excel.
- How to create a pie chart for income and expense ratio.
- Designing a lightweight presentation version in Excel.
The video tutorial shows how to present and analyze income and expense flows using built-in Excel tools to create dynamic charts.
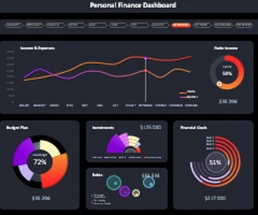
Series of video tutorials on developing a personal finance dashboard in Excel.
Download interactive income and expense chart template in Excel 
Excel Dashboard Templates for Business

Data Visualization Charts for Interactive Report Creation in Excel.
Dashboard Templates