How to create Progress Bar in Excel for Dashboard Presentation
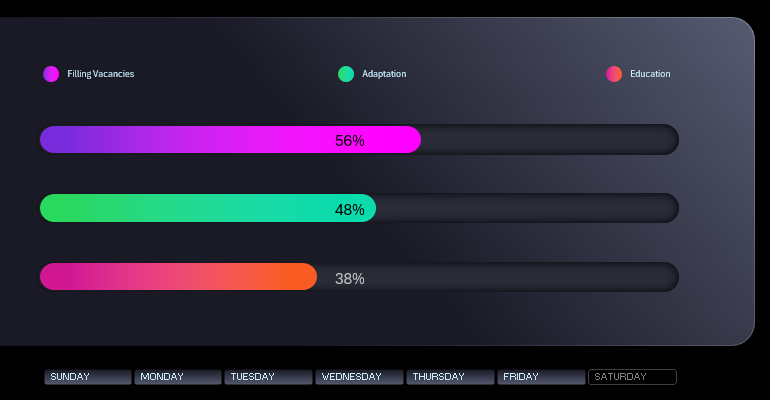
Example of how to create a beautiful progress bar in Excel. We will use only standard Excel data visualization tools and formulas to accomplish the task. We'll also add a few Excel shapes for stylish background design.
Example of Creating a Stylish Progress Bar for an Excel Dashboard
First, create a table with the source data for the chart. After the header rows, the first column contains a spacer for design purposes. It only serves an aesthetic function. The second column contains the source values. The third column is another spacer for visual appearance. Finally, the fourth column contains a formula for calculating the remainder from 100%, subtracting the portion filled by the progress bar. We also need formulas for the data labels. These will use logical functions.

If the progress bar is more than half full, the label color will change. The chart's background is dark, and the progress bar stripe is bright. The label text on the progress bar must be readable and display well on either a dark or bright background. We will use a logical formula to change the label text color in Excel without using macros. Let’s see how we can do this...
Building a Histogram Template for Prototyping the Progress Bar
Select the table range from A3 to E5 and create a horizontal bar chart.
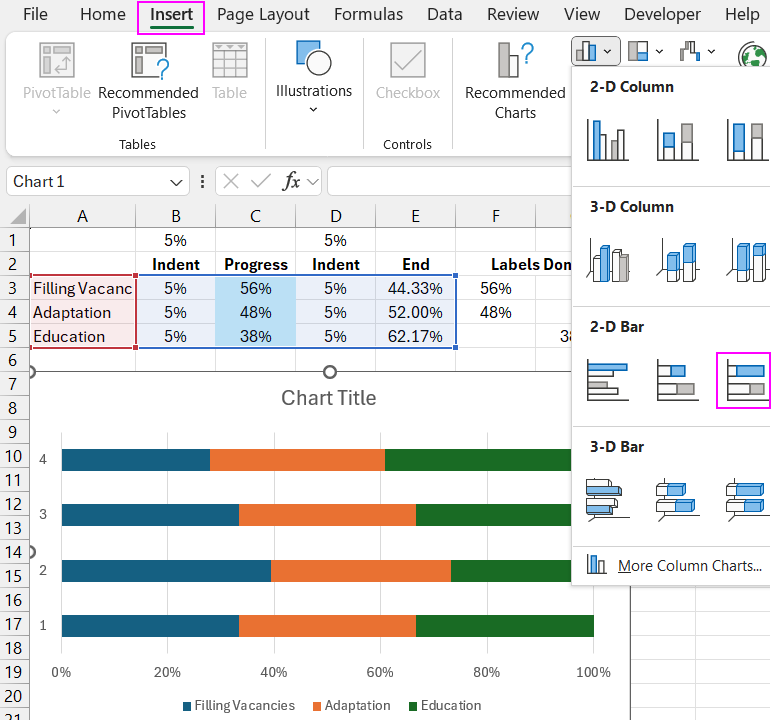
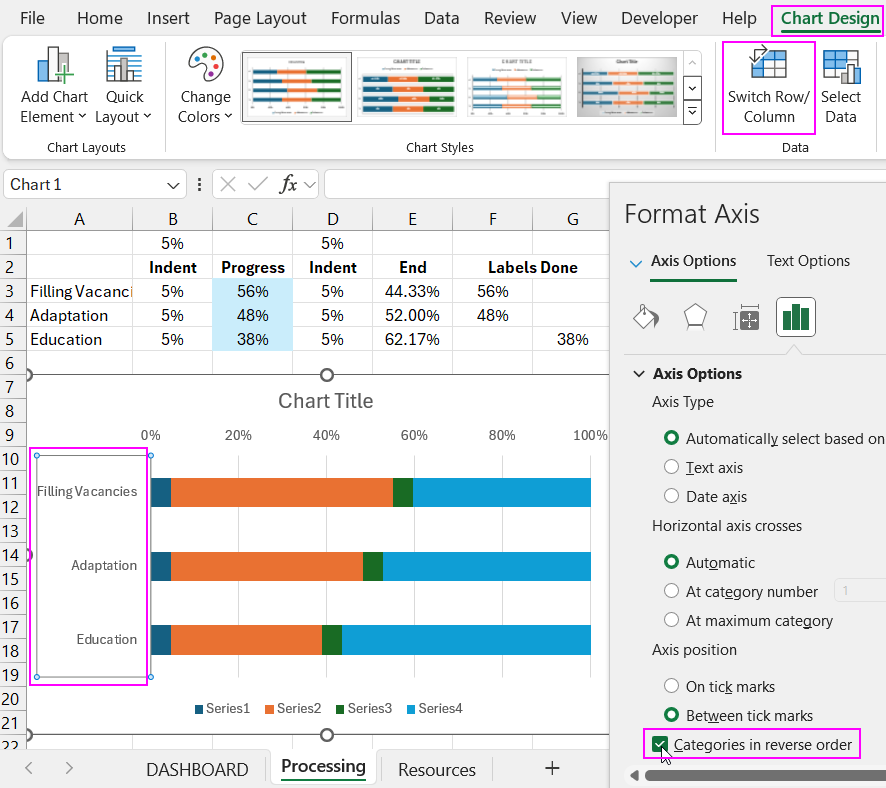
First, use the switch row/column button on the chart. Then enable the reverse option for the vertical Y-axis coordinates so that the data from the first column of the source table is in the topmost row of the chart.
Designing the Progress Bar in Excel
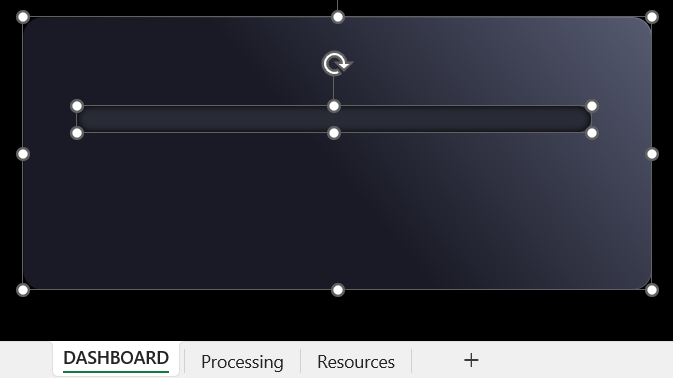
On a separate sheet, create a rounded rectangle shape. Specify the height and width of the shape. Apply a gradient fill for the background and border.
We need another rounded rectangle shape, but this time with maximally rounded corners. Set the color and create an inner shadow effect. Adjust the depth of the inner shadow by changing the blur parameter to approximately 17 points. This design will serve as the backdrop for the progress bar. Align all shapes horizontally at the center.
Move the bar chart template to the new sheet and overlay it on the shapes. Adjust the sizes, make the background transparent, and remove all unnecessary objects and labels from the chart. Only the bars should remain.
It’s time to use the spacers for design. Create a semicircle shape for each spacer. Rotate the semicircle shape for the left spacers 180 degrees and flip vertically. Each semicircle should have its own color for each spacer.
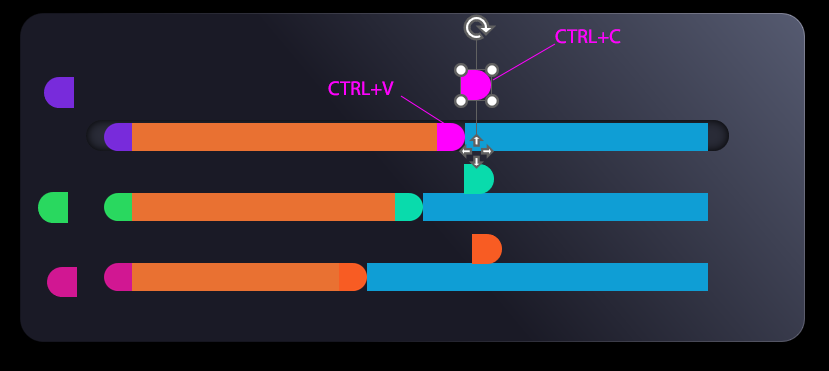
Copy the semicircle shape, then select only one spacer in one bar of the chart, and paste the shape as the background fill for the spacer using the Ctrl + V shortcut. Repeat these actions for all six spacers on the three bars of the chart template.
Make the last portion of the chart bars transparent. Fill the main portion of the progress bar with a gradient so that the colors at the beginning and end match the semicircle shapes in the spacers. Do this for all three filling bars of the progress bar.
Temporarily hide the progress bar template and copy the background shape with the inner shadow. Make the bar chart template visible again and position the new background shapes evenly under each bar.
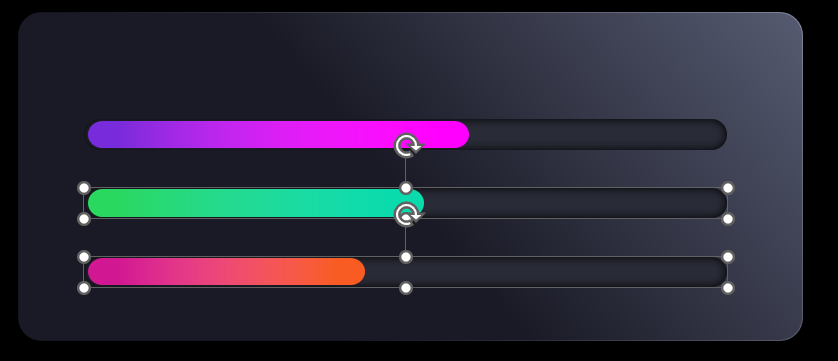
In the data table, change all three source filling values to a maximum of 100% to align the progress bar template with the background design.
Create three TextBox objects for the progress bar data labels. For each TextBox, link to the cells in the first column with logical label formulas. Align the labels and copy them. In the copies, create links to the second column of labels with logical formulas. The first three TextBoxes should be dark, while the new three TextBoxes should have light font color and be overlaid on top of the first objects.
Now, if the background under the labels is dark, they will have a light font color, and if the background is bright, the labels will have a dark font for easy readability.
Creating Control Buttons for Filling the Progress Bar
Create a mini-database table for testing the interactive features of the progress bar filling chart. In the first column, list the days of the week, followed by three columns with the row header names from the chart's source table. Simply copy and transpose them using Excel's paste special feature.
Fill the table with random values up to 100% using the RANDBETWEEN formula divided by 100. Sort each column in ascending order and apply a percentage format to the cells.
Create a pivot table based on the mini-database and place it in cell A10, specifying a link to it in the creation parameters. In the pivot table designer, set the rows to show days and connect the remaining columns, which are automatically placed in the values field.
Create a slicer from the pivot table. We will use it as a control element for filling the progress bar interactively. In the slicer styles, create a new button design template by duplicating and stylishly modifying its appearance in the parameter settings.
Set the field parameters to average for each pivot table summary value. Use the GETPIVOTDATA function to link the chart's source table to the pivot table, which is controlled by the slicer as a filter. Move the slicer buttons and control the progress bar with them to test the interactive capabilities.
We need to fix a minor bug in the labels. Add the TEXT function to the arguments of the logical formula to convert values from numeric to percentage format.
Example of a Progress Bar You Can Create in Excel
Let's test the functionality of the progress bar controlled by the slicer.
As you can see, you can create interesting designs for progress bars with interactive features in Excel without using macros. Just use standard tools, formulas, pivot tables, and a little imagination.

