DOWNLOAD a Sales Funnel in Excel Download Template
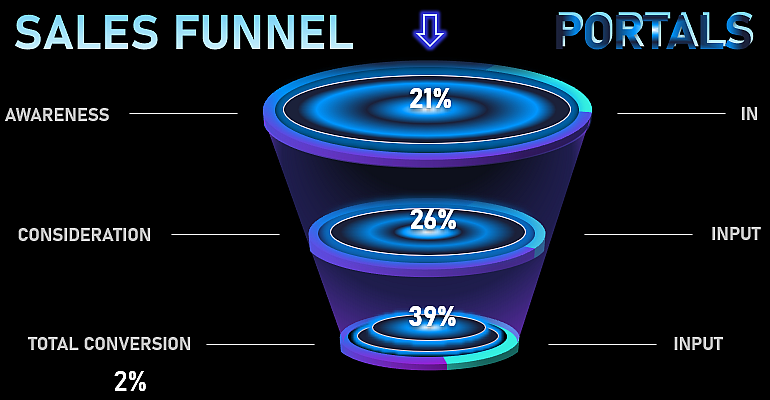
Looking for a way to present conversion data for KPI metrics into sales? A sales funnel chart in Excel is the perfect tool for visualizing the conversion process and highlighting the best strategies for key customer acquisition metrics. This guide will show you how to create, customize, and get a ready-to-use Excel template tailored to your needs.
Step-by-Step Guide to Creating a Sales Funnel Chart in Excel

Learn how to create a visually appealing sales funnel chart in Excel to effectively present your data. This video tutorial contains exciting ideas for setting up creative designs.
Steps for building your Excel presentation shown in the video:
- Set up source data on conversion statistics for different strategies.
- Formulas for building a sales funnel in Excel.
- Create a chart for the first stage of the funnel.
- Example of how to create a futuristic design for a 3D chart in Excel.
- Create complex shapes for the chart design using MS PowerPoint.
- How to make interactive buttons for managing data on the Excel dashboard.
- Style your presentation with dynamic data labels.
- Presenting the sales funnel with a futuristic design in Excel.
You can freely download the Excel template and explore the principles of data visualization for effective learning and personal use.

