DOWNLOAD Quickly a Map Chart for Dashboard in Excel
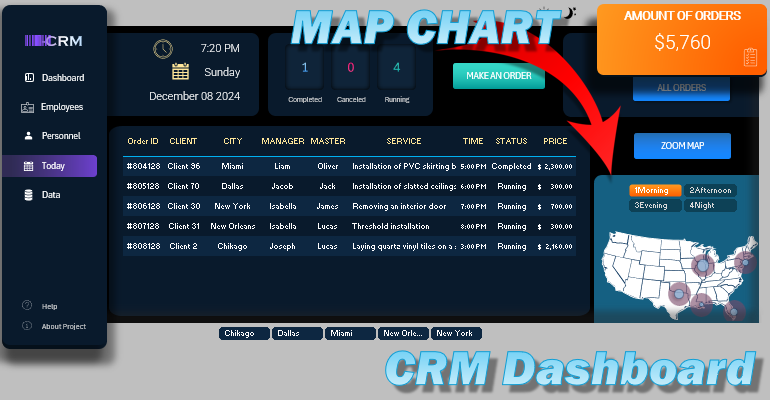
An example of how to create a versatile and interactive map chart in Excel with a step-by-step guide for beginners and advanced users. Visualize data like a pro with interactive and dynamic features. Enhance your ERP and CRM systems with powerful tools in Excel.
Step-by-Step Guide to Creating Interactive Map Charts in Excel

Creating a map chart in Excel is a powerful way to visualize geographical data and improve your dashboards or interactive presentations. Whether you're a beginner or an advanced user, this guide will help you design simple and professional map charts tailored to your needs.
In this video tutorial, you will learn:
- How to create a universal map chart from vector shapes for all versions of MS Excel.
- Adding interactive buttons for a custom map chart in Excel.
- Managing source data using smart tables.
- Filling the entire "Processing" worksheet with formula tables to create a CRM system template in Excel.
- Formula tables as source data for building a professional map with data charts.
- How to create professional data visualizations on Bing Maps using an Excel extension from Microsoft developers.
- Setting up the dashboard grid template for order analysis in a CRM system.
- Filling the main order table with formulas to extract data from the database based on conditions, styled with conditional formatting.
- Designing a dynamic dashboard with an interactive map for the CRM system.
- Using MS PowerPoint to create complex shapes if needed.
- Integrating the interactive map chart into the CRM template design.
- Building a convenient form for adding new orders to the CRM database.
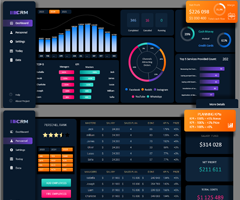
- Creating a light version of the dashboard template design.
- Editing the universal map chart to adjust the design for a light style.
- Reviewing and enjoying the results of creating a dashboard with interactive maps for a CRM system in Excel.
This is the final video tutorial in the series: How to Create a CRM Dashboard in Excel!

Learn how to create a map chart for an Excel dashboard with our community. Subscribe to our YouTube channel for beginners and advanced data visualization developers in MS Excel.

