Simple Logistics Expense Dashboard in Excel
Logistics expenses directly impact business profitability. A simple Excel dashboard allows you to structure and control transportation, depreciation, and additional cost data, enabling fast analysis without complex configuration.
Mini dashboard for analyzing transportation logistics expenses in Excel
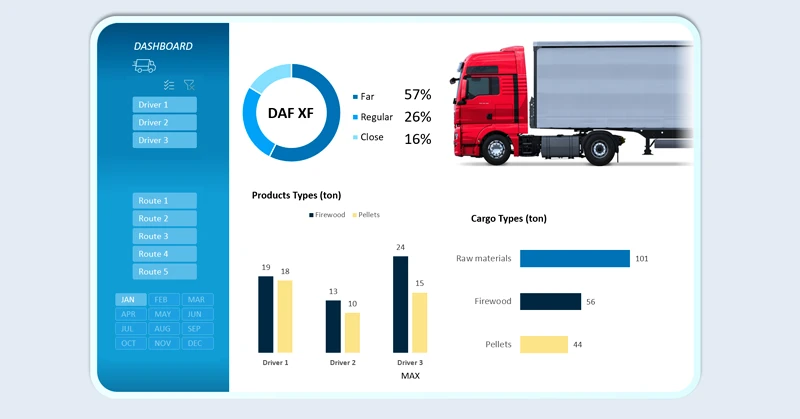
It is always useful to have a tablet with an open dashboard in a clear and convenient data visualization format. A simple dashboard displays only key metrics:
- Volume and weight of transported goods.
- Depreciation expense structure.
- Overall expense breakdown by:
- transport type;
- routes;
- drivers;
- reporting periods.
This approach helps you consistently keep your finger on the pulse of the business.
How else can data be used for a simple and clear report? There is always room for improvement, even in an effective solution. With a ready-made Excel template, you can easily expand the capabilities of a simple dashboard to fit your specific business needs. For example:

Comprehensive logistics analysis in an interactive Excel dashboard
A simple logistics expense dashboard in Excel helps quickly identify overspending areas and optimize the budget in a timely manner. Clear metric structure and intuitive visualization make cost control transparent and manageable, even with limited analytical resources. With Excel, you can flexibly customize report templates to meet the unique needs of your small business—often more efficiently than with expensive software solutions.
 Download the simple logistics expense dashboard in Excel
Data Visualization Charts for Interactive Report Creation in Excel.
Dashboard Templates