Small Business Dashboard for Luxury Packaging in Excel
In today's fast-changing business world, small business owners need effective tools to monitor performance, sales, and expenses. The Excel dashboard for premium packaging offers a cost-effective solution. It allows you to visualize key data, identify trends, and make data-driven decisions without expensive software. Whether you are managing finances, tracking inventory, or analyzing customer trends, a well-designed Excel dashboard can be a game-changer for your business.
Key Benefits of Using an Excel Dashboard
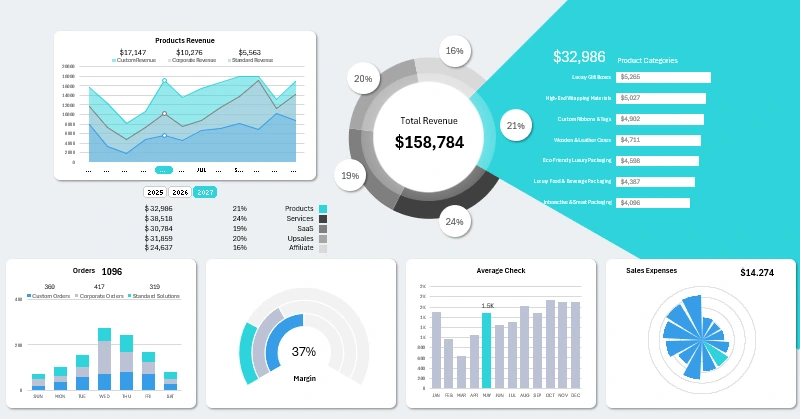
The interactive Excel dashboard showcases key business metrics, including revenue indicators, cost analysis, and product trends. Watch as we explore dashboard features such as dynamic charts, slicers for data filtering, and visualizations. All of these track sales and profit margins across different product categories. This presentation highlights how the dashboard provides valuable insights for data-driven decision-making, optimizing operations, and improving overall business efficiency in the luxury packaging industry. Whether you are managing finances, sales, or customer segments, this dashboard offers a clear and professional way to monitor and analyze critical data for business growth. In this video, we introduce a comprehensive KPI dashboard designed for small businesses in the luxury packaging sector. Content and key aspects:
- Working with source data, formulas, and pivot tables.
- Creating source data tables for charts.
- Building two pivot tables: dynamic and static.
- Using formulas to segment total revenue by income sources.
- Creating a chart template for comparative analysis of product shares in the overall revenue group.
- Composing visualizations by combining multiple charts and shapes in an Excel group.
- Sub-chart of product categories sorted by descending revenue.
- A separate visualization block with three line charts showing revenue trends.
- Using GETPIVOTDATA formulas to populate the revenue graph table.
- A combined multi-layered chart visualizing revenue dynamics for three product formats: customized, corporate, and standard solutions.
- Adding slicers as dashboard controls and configuring connections to specific pivot tables.
- Formulas for calculating revenue shares for dynamic data labels on the dashboard.
- Formulas for dashboard legend labels.
- KPI visualization block for average check by month.
- Polar chart for analyzing implementation costs.
- KPI visualization of order activity on different days of the week, segmented by three types of offerings: customized, corporate, and standard solutions.
- KPI block for margin visualization across three target audience categories: custom-tailored solutions, corporate solutions, and standard ready-made products.
- Final dashboard functionality check and minor issue resolution.
- Presentation of the interactive Excel dashboard for small businesses.
The Excel dashboard for small businesses in luxury packaging sales is a crucial tool aimed at optimizing operations, improving decision-making, and staying ahead of competitors. With customizable features and analytics, it provides everything needed for effective sales management—all within the familiar Excel environment, without using macros.


Data Visualization Charts for Interactive Report Creation in Excel.
Dashboard Templates