Small Dashboard for KPI and Sales Correlation in Excel
Effective analysis of the correlation between KPIs and sales volumes provides insights into how different factors impact overall results. Creating a compact dashboard in Excel allows you to quickly evaluate the relationships between metrics and make informed decisions. Identifying growth areas in business is crucial, as these are the focal points for applying maximum effort and resources.
Dynamic Design of a Small Sales and KPI Correlation Dashboard

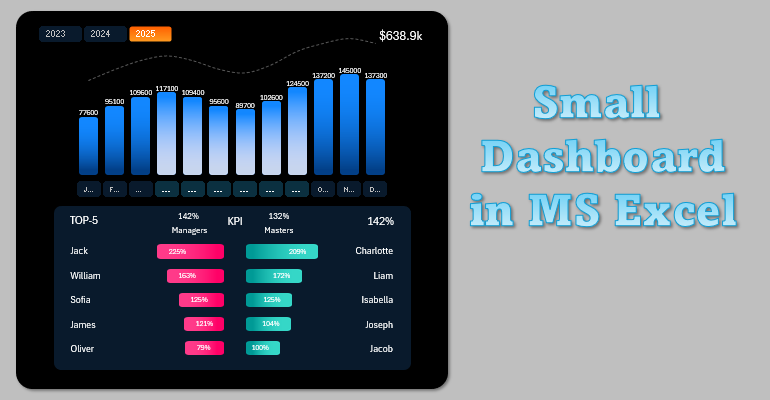
In this video tutorial, you’ll learn how to create a small yet powerful dashboard. It is designed to simplify data analysis and optimize sales strategy.
Key aspects covered in this tutorial:
- Custom grid layout for a mini dashboard.
- Creating a smart table based on sales data.
- Building a pivot table using a named range from the smart table.
- Formula table for a multi-layered bar chart analyzing sales volumes.
- Creating a bar chart template with data sampling functionality on the mini dashboard.
- Using additional features in MS PowerPoint’s shape editor, which are not available in MS Excel.
- Designing a dynamic layout for the multi-layered bar chart.
- Adding a button panel for switching data by month.
- Background design for the histogram with data sampling.
- Adding a button panel for switching data by year.
- Displaying large numbers in text format instead of zeros using Excel cell formatting.
- Formula table for processing and sorting source data for KPI analysis.
- How to use the DSUM function in Excel.
- Source table for butterfly chart to analyze KPI metrics.
- Creating a butterfly chart template for comparative analysis of KPI and sales correlation in Excel.
- A small yet very convenient Excel dashboard for visual comparative analysis of sales and KPI correlation.
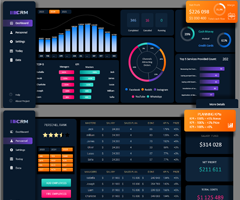
This dashboard is part of a chart category for developing a comprehensive mini CRM system in Excel.

Now you’ll learn how to link various KPIs with other metrics, such as sales volume and productivity, to quickly track correlations and understand how these metrics influence one another. You’ll also identify which employee categories need extra attention to achieve sales targets.
Download Mini Dashboard Template for KPI and Sales Correlation Analysis in Excel 
