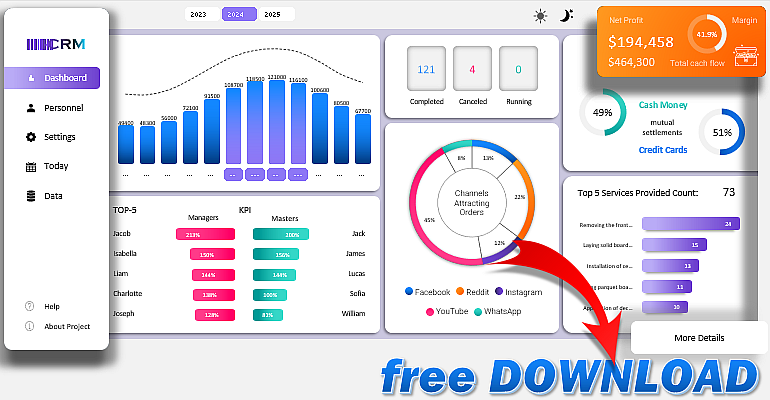
Video Course: How to Create KPI Charts for Excel Dashboard
With Excel, you can design professional KPI charts tailored to your CRM dashboard. This guide will teach you how to develop, customize, and optimize charts for monitoring critical metrics. The course is designed for intermediate Excel users. Create everything in Excel that simplifies achieving your business goals—that's the purpose of our educational resource.
Free Video Course on Building KPI Charts for CRM in Excel

Learn how to create interactive KPI charts for your CRM dashboard using Excel. This comprehensive video tutorial offers step-by-step instructions, practical visualization tips, and examples to help you track and improve sales performance.
Overview of the Free 7-Hour Training Course:
- How to build a compact Excel dashboard to correlate sales KPIs.
- How to set up a pie chart in Excel with percentages.
- How to create dynamic charts for an Excel CRM dashboard.
- How to construct dynamic tables and charts for a CRM dashboard.
- How to develop a KPI dashboard in Excel for CRM systems.
- How to create a map chart in Excel for beginners and advanced users.
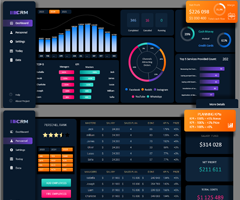
Find more templates for charts and graphs to develop CRM systems in Excel for this video course by clicking this image:

Boost your marketing outcomes and customer relationship management by effectively using your new Excel skills.
Download All CRM Dashboard Templates with KPI Charts in Excel 
