How to calculate IRR by formula in Excel for Chart
IRR (Internal Rate of Return) is an indicator of the internal rate of return of an investment project. It is often used to compare different proposals for the growth and profitability perspective. The higher the IRR, the greater is the growth prospects for this project. Let’s calculate the interest rate of IRR in Excel.
The economic meaning of the indicator
Other names: the internal rate of profitability (profit, discount), the internal factor of recoupment (efficiency), an internal norm.
The IRR coefficient shows the minimum level of profitability of the investment project. In another way: it is the interest rate at which the net present value is zero.
The formula for calculating the indicator manually:
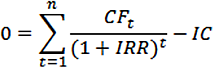
- CFt – is cash flow for a certain period of time t;
- IC – is investments in the project at the stage of entry (launch);
- t – is the time period.
In practice, the IRR ratio is often compared with the weighted average capital cost (WACC):
- IRR above WACC: this project should be carefully considered.
- IRR below WACC: it is inappropriate to invest in the development of the project.
- Indicators are equal: the minimum permissible level (the enterprise needs to adjust the cash flow).
Often the IRR is compared in percentages on a bank deposit. If the interest on the deposit is higher, then it is better to look for another investment project.
Example of calculating IRR in Excel
You can quickly calculate the IRR using the built-in Excel IRR function. Syntax:
- Range of values - reference to cells with numerical arguments for which you want to calculate the internal rate of return (at least one cash flow must have a negative value).
- Assumption - a value that is supposedly close to the value of the IRR (the argument is optional; but if the function produces an error, the argument must be specified).
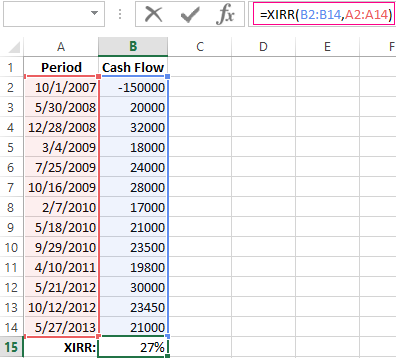
Take the conventional figures:
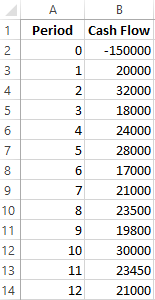
The initial costs were 150,000, so this numerical value entered the table with a minus sign. Now we’ll find the IRR. The formula for calculation in Excel:
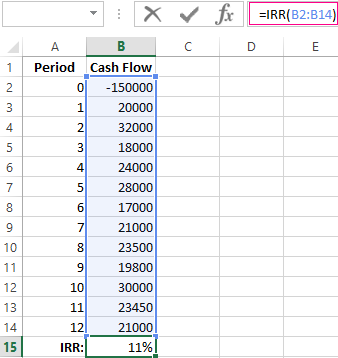
Calculations showed that the internal rate of return on the investment project is 11%. For further analysis, the value is compared with the interest rate of the bank deposit, or the cost of the capital of the project, or IRR of another investment project.
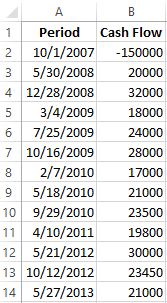
We calculated the IRR for regular cash income. The IRR function cannot be used with non-systematic income because the discount rate for each cash flow will vary. We solve the problem with the help of the function XIRR.
We modify the table with the initial data for the example:
The mandatory arguments of the XIRR function are next:
- Values are cash flows;
- Dates are an array of dates in the appropriate format.
The formula for calculating IRR for non-systematic payments:
A significant drawback of the two previous functions is the unrealistic assumption about the rate of reinvestment. It is recommended to use the MIRR function to correctly consider the assumption of reinvestment.
Arguments:
- Values are payments;
- Financing rate is interest paid for funds in circulation;
- The rate of reinvestment.
Suppose that the discount is 10%. There is a possibility of reinvesting the revenues at a rate of 7% per annum. We calculate the modified internal rate of return:
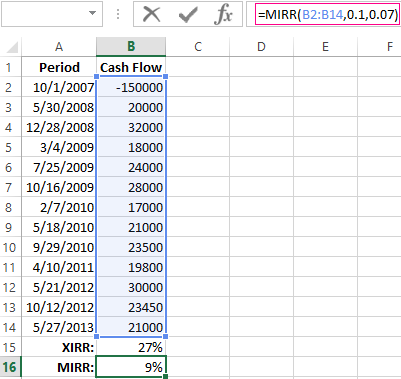
The resulting rate of return is three times less than the previous result. And it’s below the financing. Therefore, the profitability of this project is doubtful.
Graphical method for calculating IRR in Excel
The IRR value can be found graphically by plotting the net present value (NPV) versus the discount rate. NPV is one of the methods for evaluating an investment project which is based on the methodology of discounting cash flows.
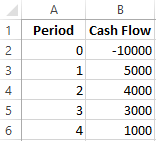
For example, take a project with the following structure of cash flows:
You can use the NPV function to calculate NPV in Excel:
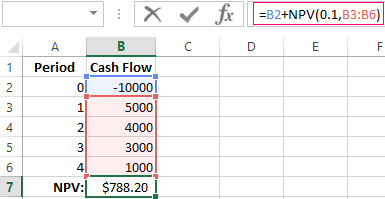
Since the first cash flow occurred in the zero periods, it does not have to enter the value array. The initial investment should be added to the value calculated by the NPV function.
The function discounted cash flows for periods from 1 to 4 at a rate of 10% (0.10). It is impossible to accurately determine the discount rate and all cash flows when analyzing a new investment project. It makes sense to look at the dependence of NPV on these indicators. In particular, look how it depends on the cost of capital (discount rates).
We calculate NPV for different discount rates:
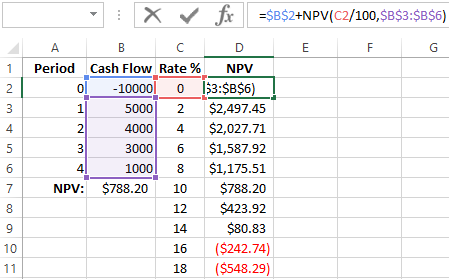
Let's see the results on the chart:
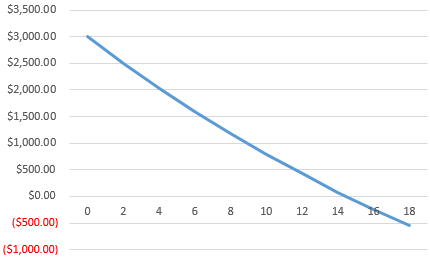
Remember that the IRR is the discount rate at which the NPV of the analyzed project is zero. Therefore, the intersection point of the NPV graph with the abscissa axis is the internal profitability of the enterprise.

Data Visualization Charts for Interactive Report Creation in Excel.
Dashboard Templates