Download template of the investment project analysis in Excel
For attracting and investing funds in a business, the investor needs to carefully study the domestic and foreign markets.
On the basis of the data obtained, you need to draw up an estimate of the project, an investment plan, to forecast revenues, to generate a statement of cash flows. Most complete all the necessary information can be represented in the form of the financial model.
The financial model of the investment project in Excel
It is made for the forecasted payback period.
The main components:
- the description of the macroeconomic environment (inflation rate, interest on taxes and fees, the required rate of return);
- projected sales;
- projected costs for recruiting and training staff, renting space, purchasing raw materials and materials, etc .;
- analysis of working capital, assets and fixed assets;
- sources of financing;
- risk analysis;
- forecast reports (payback, liquidity, solvency, financial stability, etc.).
For the project to inspire confidence, all data must be confirmed. If an enterprise has several items of income, then the forecast is compiled separately for each.
The financial model - is a plan to reduce risks when investing. Detailing and realism are mandatory conditions. When creating the project in Microsoft Excel, the following rules are observed:
- initial data, calculations and results are on different sheets;
- the structure of calculations is logical and «transparent» (no hidden formulas, cells, cyclic references, limited number of array names);
- the columns correspond to each other;
- in one line - the same type of formula.
The calculation of economic efficiency the investment project in Excel
To assess the effectiveness of investments, two groups of methods are used:
- statistical (PP, ARR);
- dynamic (NPV, IRR, PI, DPP).
Payback period:
The PP coefficient (payback period) shows the time period, for which the initial investment in the project will be repaid (when the invested money will be returned).
The economic formula for calculating the payback period:
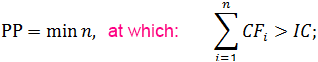
where IC – is the initial investment of the investor (all costs),
CF – is the cash flow, or net profit (for a certain period).
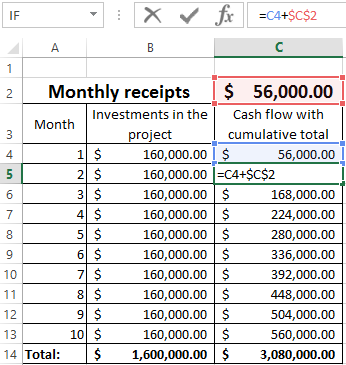
The calculation of the recoupment of an investment project in Excel:
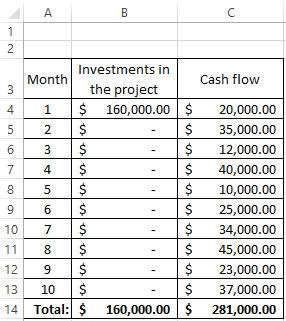
- Let's make the table with the initial data. The cost of the initial investment - is 160 000$. Monthly comes 56 000$. To calculate the cash flow cumulatively, the formula was used:
- We calculate the payback period of the invested funds. The formula was used: =B4/C2 (the amount of initial investment / the amount of monthly receipts).
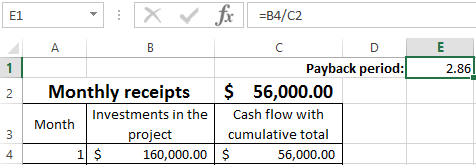
Since we have the discrete period, the payback period will be 3 months (2,86).
This formula allows you find the payback period indicator of the project quickly. But it is extremely difficult to use it, because monthly cash receipts in real life are rarely equal amounts. Moreover, the inflation is not taken into account. Therefore, the indicator is used in conjunction with other criteria for assessing effectiveness.
Return on Investment
ARR, ROI – there are coefficients of profitability, showing the profitability of the project without discounting.
The calculation formula:
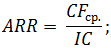
Where CF av. – is the average net profit for a certain period;
IC - is the investor's initial investment.
The calculation example in Excel:
- Change the input data. The initial investments of 160 000$ are paid only once, at the start of the project. Monthly payments – there are different amounts.
- Calculate the average income by months and find the profitability of the project. We use the formula: =AVEDEV(C4:C13)/B4. The format of the cell with the result is a percentage.
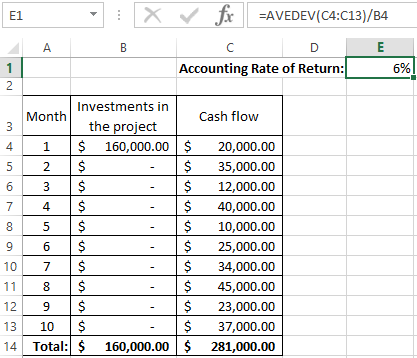
The higher the profitability ratio, the more attractive the project. The main disadvantage of this formula - is that it is so difficult to predict future receipts. Therefore, the indicator is often used for analyzing of the existing enterprise.
The examples of the investment project with calculations in Excel:
Statistical methods do not take into account discounting. But you can quickly and easily to find the necessary indicators.

Data Visualization Charts for Interactive Report Creation in Excel.
Dashboard Templates