Example of construction the financial model of the enterprise in Excel
Any business plan needs in financial calculations. But the most convenient tool for this - there is the spreadsheet Excel. The popularity of the program is due to the ease of use and versatility. Let consider to the reactor's capacity, that will be useful in the compiling of the business model.
The fundamentals of the financial model in Excel
The model can be placed on a single sheet or on different sheets. In any case, the order of the estimated tables must match to the logic description of the project:
- tables for calculation of investments;
- income and cost part;
- the financing;
- the final reporting forms and indicators.
The investment plan
The basic elements:
- construction and/or purchase of buildings;
- purchase of equipment;
- deferrals;
- investments in NWC (net working capital).
The initial data for calculation of costs for the purchase or construction of buildings:
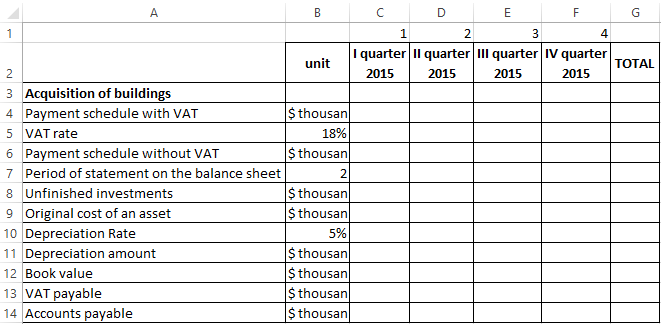
Calculations:
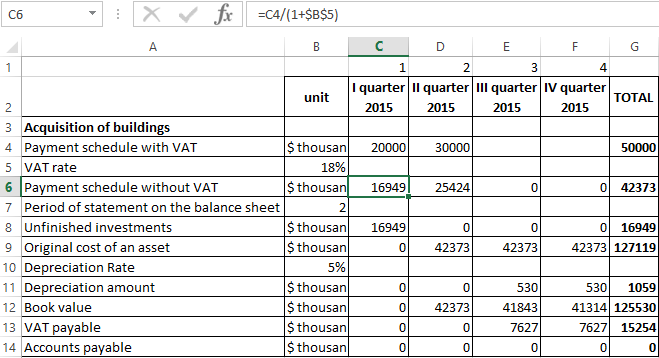
- The payment schedule without VAT = The cost including VAT. The formula in Excel for the cell C6:
- The pending investments – the amount of investments without VAT before the period of their statement on the balance. The formula in Excel for the cell C8:
- The formula for calculating of the initial value of the asset is C9:
- The amount of depreciation is calculated from the next period. The formula in Excel for cell C11:
- The carrying amount of the asset is the difference between the initial cost and depreciation for the entire period of existence of the asset. The formula in Excel for cell C12:
- Input VAT (in the period setting of the asset on the balance) – this is the total amount of the tax. The formula for cell C13:
- The formula for calculating of the accounts payable C14:
The cost of purchasing equipment and items of prepaid expenses in the investment plan are compiled similarly. Features of deferred costs:
- to be capitalized on the balance sheet within current assets;
- not subject to property tax (in contrast of the equipment);
- are depreciated more quickly, within 1-2 years.
The forecasting of revenues
To build a sales plan, you need to determine the volume in natural terms (for each product) and selling price (for each product). The revenue is recognized for each type of goods (works and services) as the product of volume and price.
The tables are made in Excel for each planning period and for each kind of product with the planned output volume (in natural units).
From selling prices you need to isolate the amount of value added tax. The money is not included in the revenue – they are listed in the budget.
The formulas:
- Price without VAT = price with VAT / (1 + tax rate).
- The value of VAT = (price with VAT * tax rate) / (1 + tax rate).
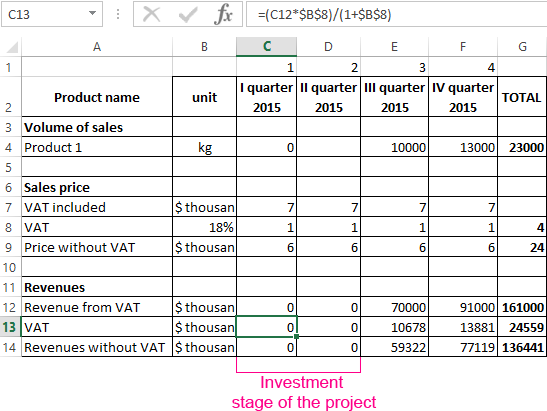
- The calculation table may look like the following:
- The formula to calculate price without VAT:
- The calculation of value added tax: = C7 - C9.
- The revenue with taxes: = C4*C7.
The current plan of expenditure
The cost items:
- raw materials;
- wage;
- accruals for salaries;
- amortization;
- other expenses.
When accounting for cost of materials, allocated to the value added tax. It is necessary to account for the refund amounts received (arrears reduced).
The cost of raw materials increases in direct proportion to the volume of the issue. For example, if sewing of one shirt requires one and a half meter of fabric, then for two units – 3 meters, etc. Consumption is computed by the following formula:
The amount of material = specific weight * the volume of production.
The table example of based the current costs of raw materials:
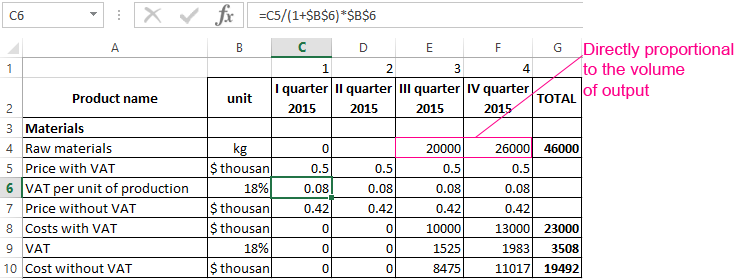
The formula for calculation of value added tax – is in the formula bar.
The formula for calculating price without VAT:
The calculation of costs including VAT: = C4*C5.
The tax on AT: = C4*C6.
Costs without VAT: = C4*C7.
Other costs:
- rent;
- advertising;
- the payment due;
- maintenance, etc.
In the preparation of the financial model of the enterprise in Excel is counted every item of expenditure.
The financial model of the enterprise in Excel
After planning sales and costs, you can begin building of the balance, the plan of incomes and expenses, the cash flow. To model the counted values in automatic regime, the dates in summary reports are calculated using of the formulas, or they are directly extracted from the operational plans (using the links).
The plan of incomes and expenses of the financial model:
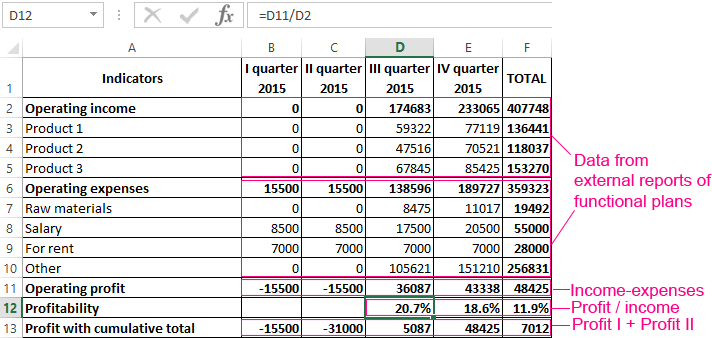
Incomes and expenses are itemized under the articles. If you plan to release of dozens product names, it will be better to determine them in groups, so as not to overload the report. In the summary table are attached to the analytical indicators: profitability and profit with the cumulative total. When you need more analysts, the single table is formed.
Plan of cash flows:
Download example of the financial model enterprise in Excel
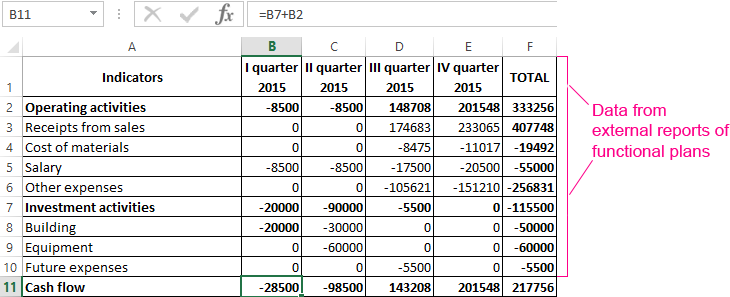
It is expected that the company will not borrowed funds, therefore the chapter «Financial activities» is absent.

Data Visualization Charts for Interactive Report Creation in Excel.
Dashboard Templates