Forecasting sales in Excel and time series analysis algorithm
Forecasting sales in Excel is not difficult to compile with all the necessary financial indicators.
In this example, we will use a linear trend for composing a sales forecast for raging periods, taking into account seasonality.
The linear trend is well suited for forming the plan for a developing company.
Excel – is the best universal analytical tool in the world, which allows not only to process to statistical data, but also to make the forecasts with high accuracy. In order to evaluate some of Excels opportunities in the field of sales forecasting, let's take a practical example.
The example of forecasting sales in Excel
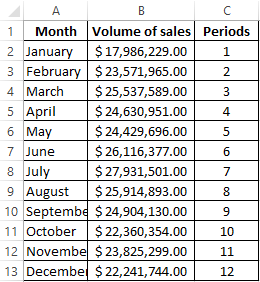
We calculate the forecast for sales, taking into account the growth and seasonality. Let's analyze sales for 12 months of the previous year and build the forecast for 3 months of the next year using the linear trend. Each month - this is for our forecast is the 1 period (y).
The linear trend equation:
y = bx + a
- y – is the sales volumes;
- x - is the number of period;
- a - is the intersection point with the y-axis on the graph (the minimum threshold);
- b – is the increase in subsequent values of the time series.
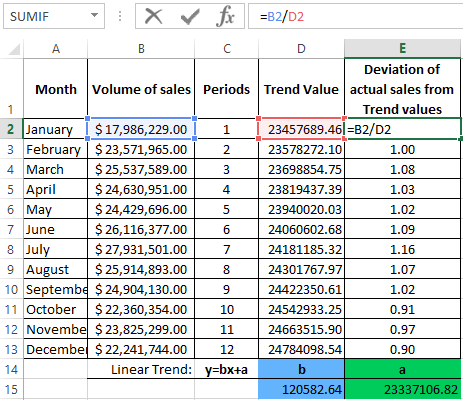
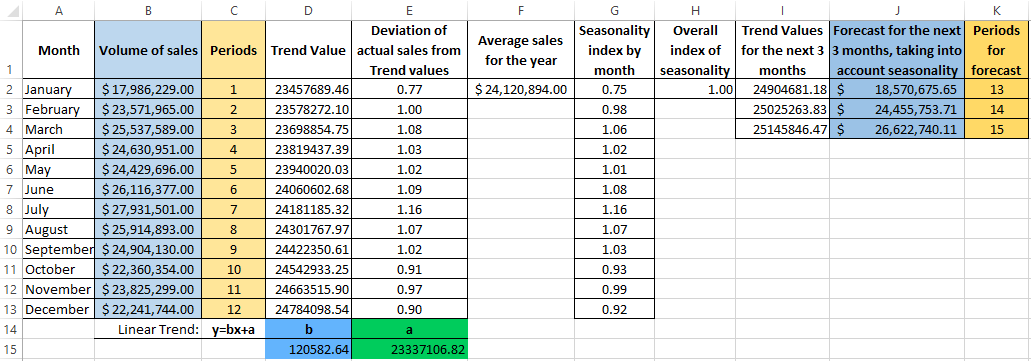
Let`s say we have the following statistics for the last year.
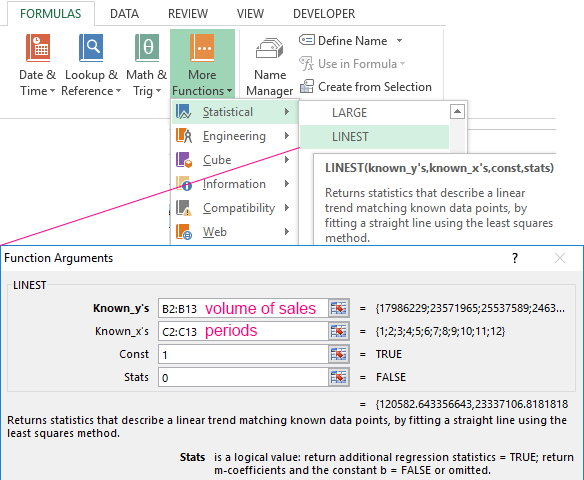
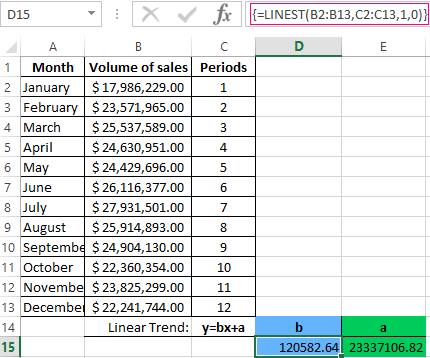
- We calculate the value of the linear trend. Define the coefficients of the equation y = bx + a. In the cell D15, we use the function =LINEST():
- Select the cell with the formula D15 and the neighboring, right cell E15, so that D15 remains active. Press the F2 button. After that, press Ctrl + Shift + Enter (to enter an array of functions for both cells). Thus, we immediately obtain 2 values of the coefficients for (a) and (b).
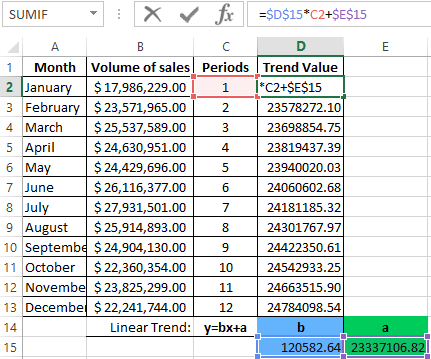
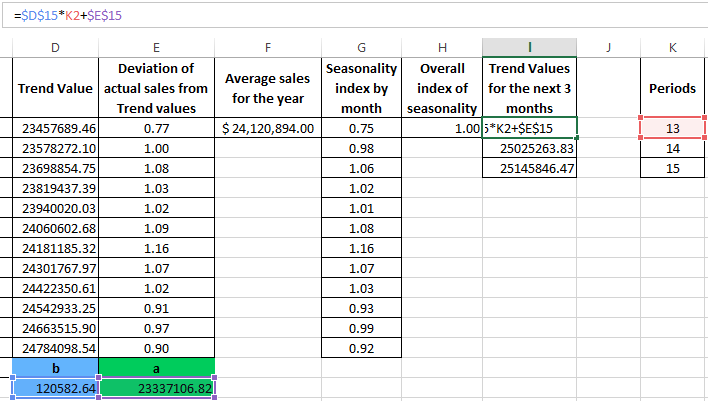
- Calculate for each period to the y-value of the linear trend. To do this, we substitute in the known equation to the calculated coefficients (x - is the number of period).
- To determine the seasonality factors, first we find to the deviation of the actual data from the trend values («selling per year»/«linear trend»).
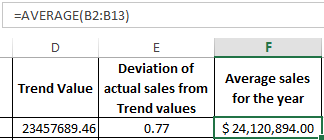
- Calculate the average sales for the year using the formula =AVERAGE(B2:B13).
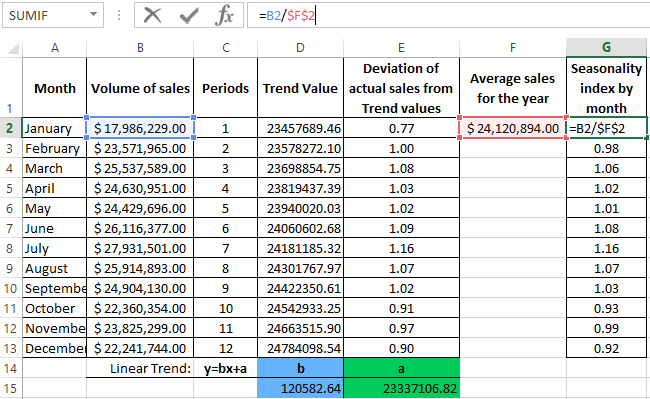
- Define the seasonality index for each month (the ratio of realization products of the month to the average value). Actually every sales volume per month is divided by the average sales volume for the year.
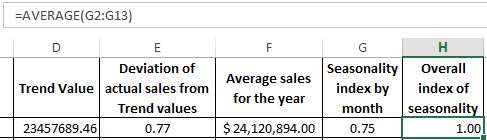
- In cell H2 we find the general seasonality index through the function:
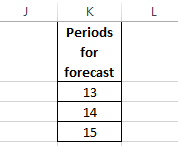
- We will forecast sales, using the growth of volume and seasonality on 3 months in advance. We extend the numbers of the time series periods by 3 values in the column K:
- We calculate the trend values for future periods: we change the value of x in the equation of the linear function. To do this, you can simply formula in cell I2: =$D$15*K2+$E$15.
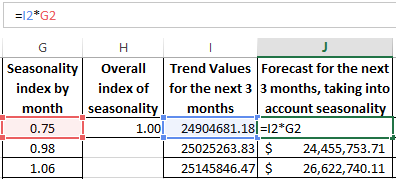
- On the basis of the data obtained, we prepare the forecast for disposition products for the next 3 months (next year), taking into account the seasonality:
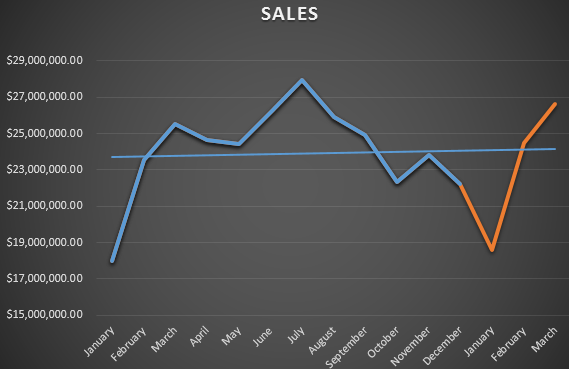
The general picture of the forecast is as follows:
The chart of the forecast of sales:
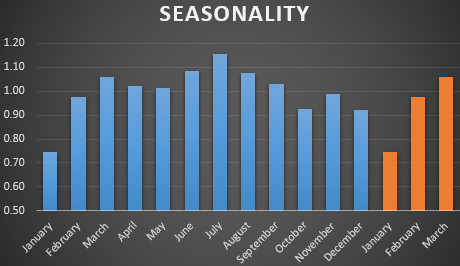
The season chart:
The algorithm for time series analysis and forecasting
The algorithm for analyzing the time series for forecasting sales in Excel can be constructed in three steps:
- We select to the trend component using the regression function.
- We determine the seasonal component in the form of coefficients.
- We calculate the forecast values for a certain period.
To see the general picture with the graphs above the forecast described above, we recommend downloading this example:
It should be understood that an accurate forecast is possible only with the individualization of the forecasting model. After all, the different time series have the different characteristics.

Data Visualization Charts for Interactive Report Creation in Excel.
Dashboard Templates