Formula to calculate Return On Equity in Excel
Return on Equity reflects the ratio of net profit from sales to the average amount of equity.
Data for calculation is taken from the financial balance sheet. The Return On Equity ratio is denoted as "ROE."
Economic Significance of the "ROE" Financial Indicator
The profitability ratio shows how efficiently invested funds were utilized during the reporting period. This indicator is crucial for investors and business owners.
There are several profitability ratios, and we are interested in the return on equity. It represents the efficiency of using assets owned by the company on the basis of ownership rights.
How to interpret the calculation results:
- The higher the ratio, the more efficiently the invested funds were used, making investments more profitable.
- Excessively high values may indicate a compromised financial stability of the organization.
- A ratio below zero raises doubts about the advisability of investing in the enterprise.
The return on equity ratio is compared with other options for investing free money in assets and securities of other firms or, as a last resort, with the bank interest rate on deposits.

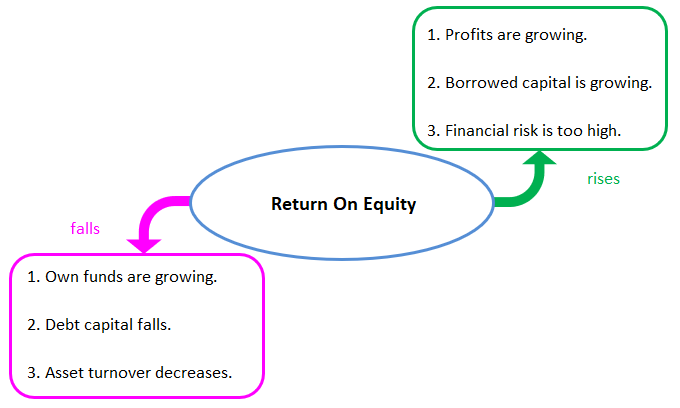
Value of return on equity:
Rises
- Profits are growing.
- Borrowed capital is growing.
- Financial risk is too high.
Falls
- Own funds are growing.
- Debt capital falls.
- Asset turnover decreases.
Formula for Calculating the ROE Indicator in Excel
The return on equity ratio is calculated as the quotient of net profit to the average amount of equity investments. Data is taken for a specific time interval: a month, quarter, or year.
Formula for calculating the return on equity ratio:
ROE = (Net Profit / Average Equity) * 100%.
Figures for calculations should be taken from the financial results report (final figure) and the balance sheet (final figure).
The average amount of equity formula:
Equity = (Equity at the beginning of the period + Equity at the end of the period) / 2.
Return on equity formula based on the balance sheet:
ROE = (line 2110 + line 2320 + line 2310 + line 2340) / ((line 1300 ng + line 1300 kg + line 1530 ng + line 1530 kg) / 2) * 100%.
Numerator – data from the financial results report (Form 2). Denominator – from the final balance sheet (Form 1).
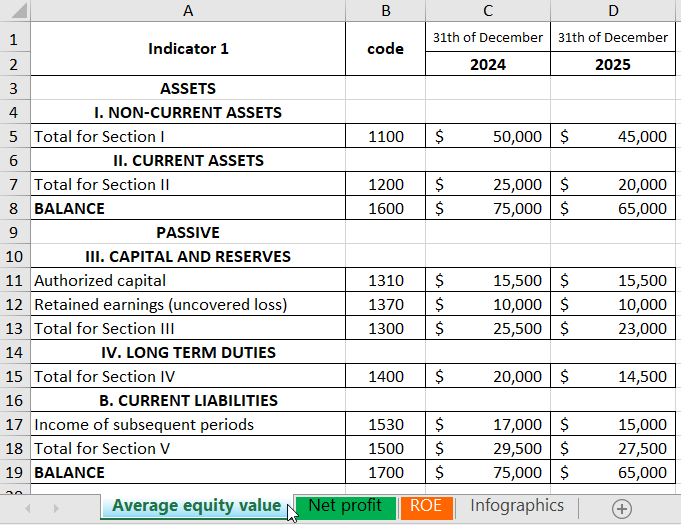
To calculate profitability using Excel, enter the data for the financial report of Company "X":

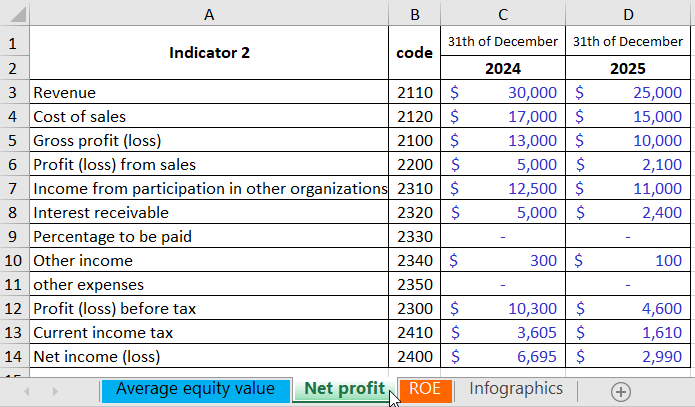
And the profit and loss statement (the old way):

The values needed for calculating the return on equity ratio are highlighted in the tables.
- Return on equity ratio for 2025: = (6695 / 75000) * 100% = 8.9%.
- Return on equity ratio for 2024: = (2990 / 65000) * 100% = 4.6%.
Automate the calculation using Excel formulas. You can create a separate table with important financial indicators and input formulas with references to the values in the corresponding reports, providing a quick way to obtain data for statistical analysis, comparison, and managerial decision-making.
Excel formulas for calculating return on equity:

 Download Example Return on Equity in Excel
Formula elements are references to cells with corresponding values. To display the ratio as a percentage immediately, set the percentage format and leave one decimal place.
Conclusions:
- There is an increase in the return on equity ratio from 4.6% to 8.9%.
- Investing free funds in the shares of Company "X" is not profitable. The bank interest rate on deposits in 2025 was 9.5%.
- It is advisable to consider other offers from enterprises or deposit money with interest (as a last resort).
Investment attractiveness of a project is not assessed solely based on return on investment. When making a decision, an investor looks at asset profitability, sales, and other criteria for the efficiency of a company's operation.
