Management accounting in Excel with examples
Management accounting is designed to represent the actual state of the enterprise business. Managerial decisions are made on the basis of management accounting data. This is a system of tables and reports with a convenient daily analysis of cash flows, profits and losses, payments to suppliers and buyers, cost of production, etc.
Each firm chooses a way of conducting the Management accounting and the data necessary for analytics. Most often, the tables are compiled in Excel.
Examples of management accounting in Excel
The main financial documents of the enterprise are a statement of cash flows and a balance sheet. The first one shows the level of sales, the cost of production and sales of goods for a certain period of time. The second one shows the assets and liabilities of the company, equity. The manager notices positive and negative trends and makes managerial decisions comparing these reports.
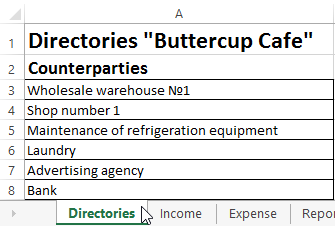
Directories
Let's describe the work accounting in a café. The enterprise sells its own production and purchased goods. There are non-operating incomes and expenses.
The Excel management accounting table is applied to automate the data introduction. It is also recommended to compile directories and journals with initial values.
- Types of counterparties. The café cooperates with suppliers of sanitary clothes, table linen, dishes food products, equipment for storage, processing, sorting and packing of goods. In the same list you can bring in banks, utilities providers, etc.
- Expenditures. The list depends on the work of a particular catering point.
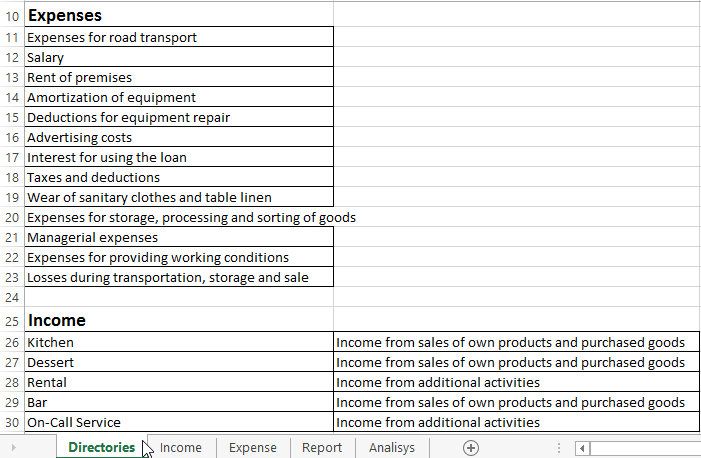
If the economist (accountant, analyst) plans to record income items, then the same directory can be created for this purpose.
Convenient and easy to understand reports
You do not need to contain in one report all the figures for the café activity. Let these be separate tables and each takes one page. It is recommended to use such tools as "down lists". Let's consider an example of the café management account tables in Excel.
Income recognition
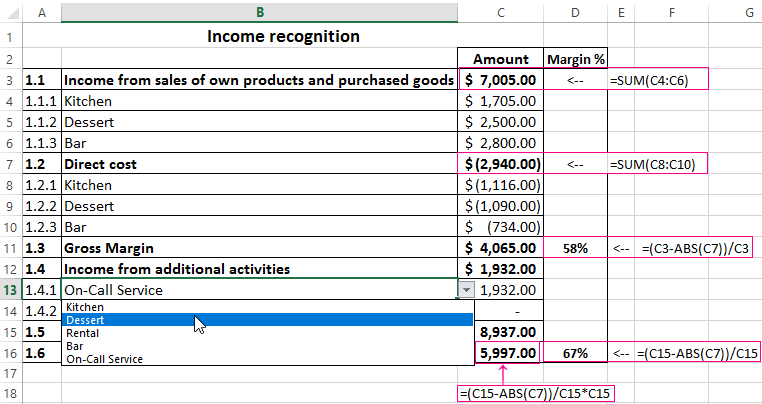
Let's take a closer look. The resulting indicators are found using formulas (conventional mathematical operators are applied). Filling the table is automated using drop-down lists.
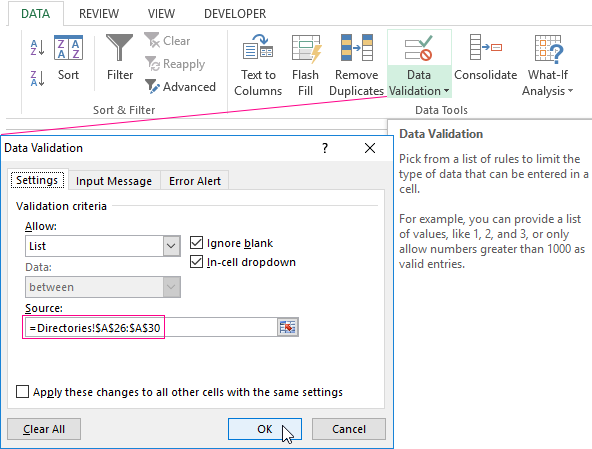
Refer to the Income Generated Directory when creating a list (Data - Data verification).
Expense recognition
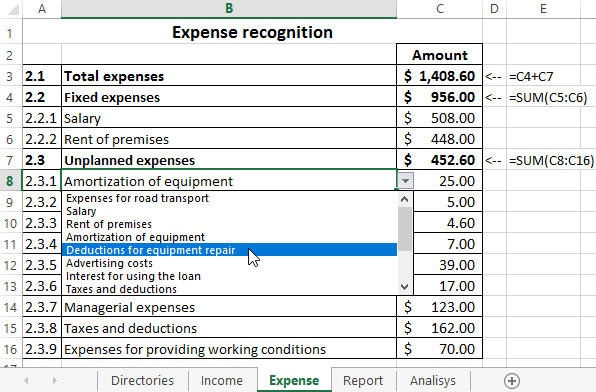
We used the same methods to fill out the report.
Profits and Losses Report
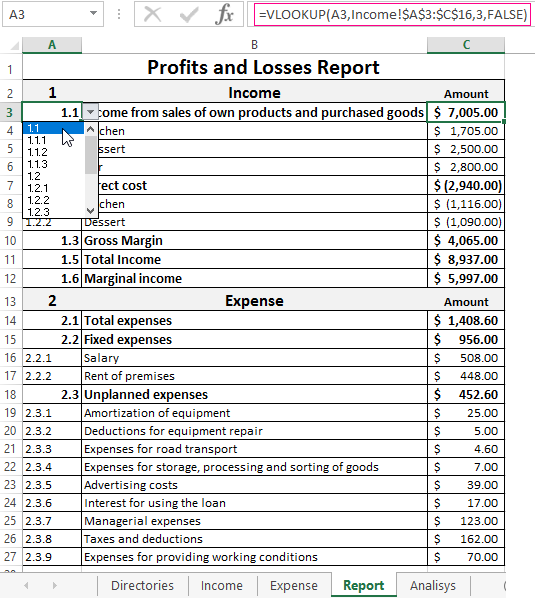
Most often the income statement is used for the purposes of management accounting, instead of using separate income and expenses reports. This provision is not standardized. Therefore, each company chooses source reports independently.
In the created report you use formulas to calculate results. This process includes AutoFill of items using drop-down lists (links to Directories) and grouping of data
Analysis of the structure of cafe property
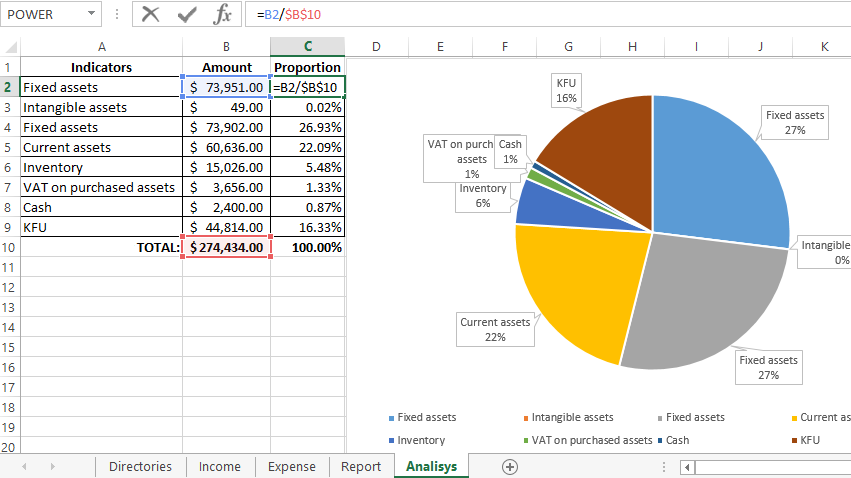
The source of information for analysis is the Balance Sheet (1 and 2 sections).
Let's draw up a diagram for better understanding the information:
The table and figure shows that the main share in the property structure of the analyzed cafe is occupied by non-current assets.
Download management accounting example
The liabilities in the balance sheet is analyzed by the same principle. These are the sources of resources through which the cafe operates.
