Data analysis report template examples for finance in Excel
Data analysis in Excel is provided by construction of a table processor. A lot of the program's resources are suitable for solving this task.
Excel positions itself as the best universal software product in the world for processing analytical information. From a small enterprise to large corporations, managers spend a significant part of their working hours analyzing their businesses activity. Let’s consider the main analytical tools in Excel and examples of their use in practice.
Excel analysis tools
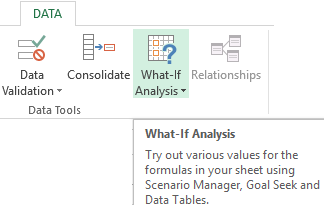
One of the most attractive data analysis is "What-if Analysis". It is located in "DATA" tab.
Analysis tools of "What-if Analysis":
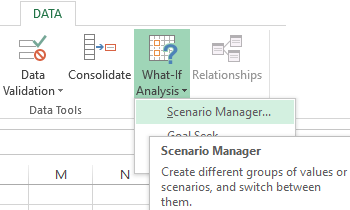
- “Scenario Manager”. It is used to generate, change and save different sets of input data and the results of calculations for a group of formulas.
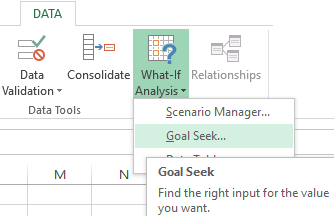
- "Goal Seek". It is used when the user knows the result of the formula, but the input information for this result is unknown.
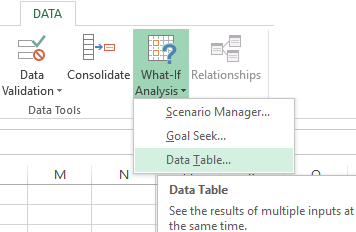
- "Data Table". Used in situations when it is necessary to show the effect of variable values on formulas in the form of a table.
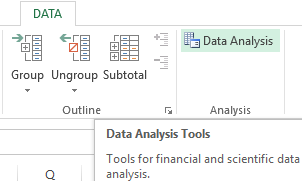
"Data Analysis". This is an Excel add-in. Helps find the best solution for a particular task.
Other tools for analysis:
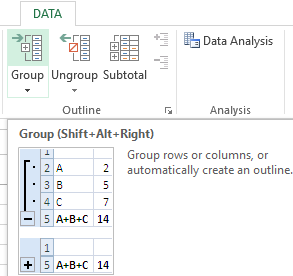
- Grouping of data;
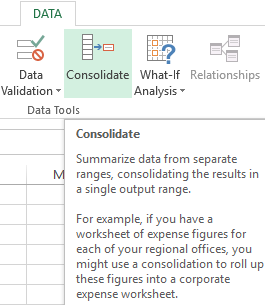
- Data consolidation (consolidation of several data sets);
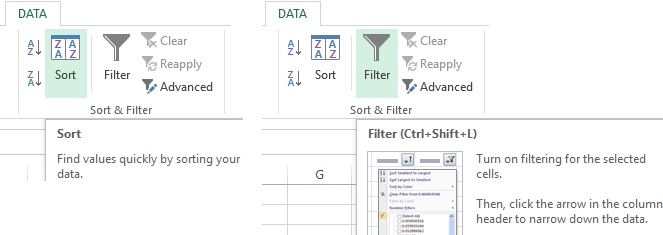
- Sorting and filtering (changing the order of the rows according to the specified parameter);
- Working with Pivot Tables;
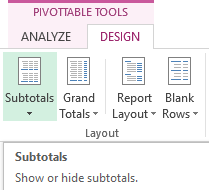
- Obtaining subtotals (often required when working with lists);
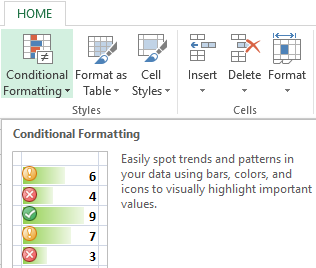
- Conditional formatting;
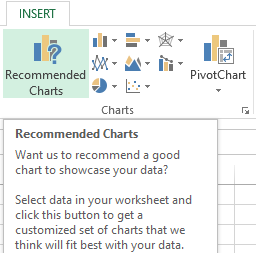
- Charts and diagrams.
Analyze data in Excel using built-in functions (mathematical, financial, logical, statistical, etc.).
Summary tables in data analysis
Excel uses summary tables to simplify the viewing, processing and consolidation of data.
The program will treat the entered information as a table, but not as a simple information set. But firstly you should format lists with values according to next steps:
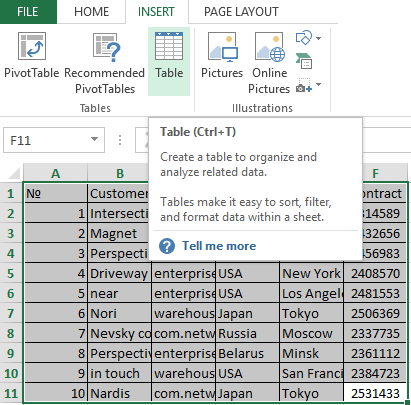
- Go to the "INSERT" tab and click on the "Table" button CTRL+T.
- The "Create Table" dialog box appears.
- Specify the range of data (if it already exist) or the expected range (in which cells the table will be placed).
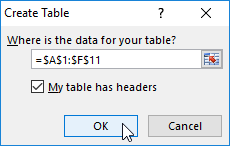
Set the check-mark in the box next to "Table with titles". Press Enter.
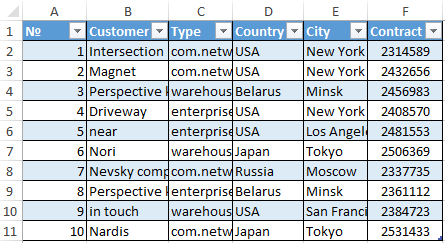
The specified default formatting style applies to the specified range.
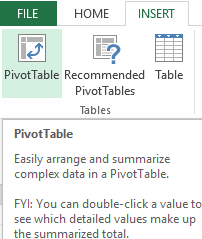
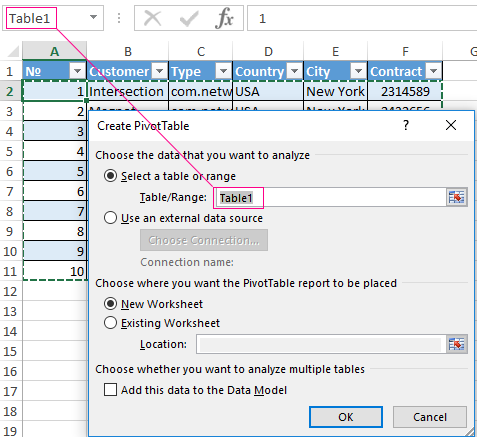
You can compose the report using the "PivotTable".
- Activate any of the cells in the values range. We click the button "PivotTable" ("INSERT" - "Tables" - "PivotTable").
- In the dialog box you specify the range and place where to put the summary report (new sheet).
- The "PivotTable Fields" opens. The left side of the sheet is the report image; the right part is the tools for creating the summary report.
- Select the required fields from the list. Determine the values for the names of rows and columns. The report will be built on the left side of the sheet.
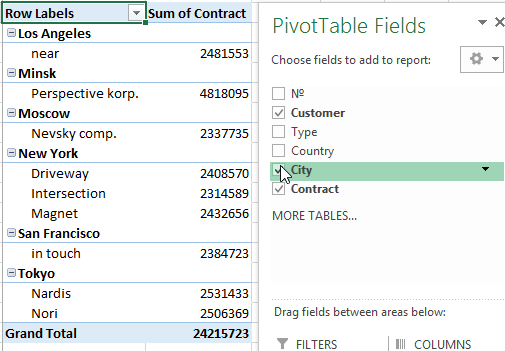
Creating a pivot table is already a way for analyzing information. Moreover, the user selects the information he needs at a particular moment for displaying. Then he can use other tools.
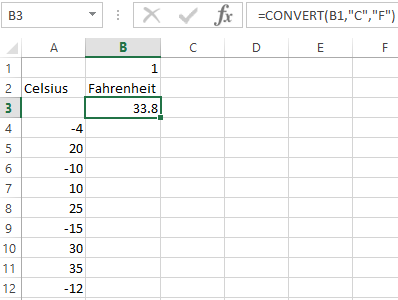
Analysis "What-if Analysis" in Excel: "Data Table"
This is a powerful tool for information analysis. Let’s consider the organization of information using the tool "What-if Analysis" - "Data Table".
Important conditions:
- data must be in one column or one line;
- the formula refers to one input cell.
The procedure for creating analysis:
- We enter the input values in a column. Enter the formula in the next column one line higher.
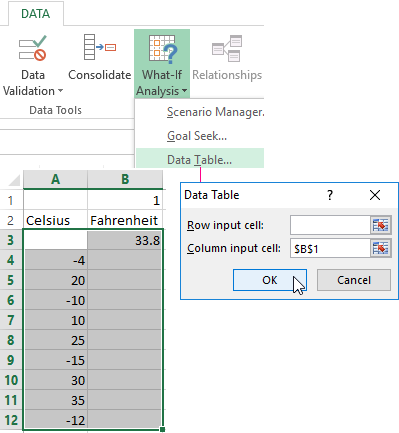
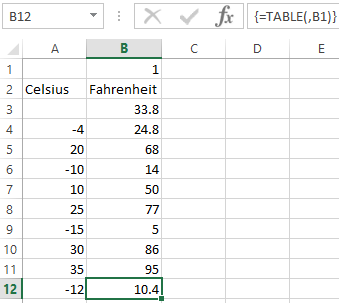
- We select a range of values including a column with input values and a formula A3:B12. Go to the "DATA" tab. Open the "What-if Analysis" tool. We click the "Data Table" button.
- There are two fields in the opened dialog box. Since we create a table with one input we enter the address only in the field "Column input cell:". If the input values are in lines (not in columns), we will enter the cell’s number in the field "Row input cell: " and click OK.
- Download enterprise analysis system
- Download analytical finance table
- Business profitability table
- Cash flow statement
- Example of a point method in financial and economic analytics
When using the features Excel, to analyze the enterprise activity, we use information from the balance sheet and income statement. Each user creates his own form, which reflects the features of the company and important information for decision-making.

Data Visualization Charts for Interactive Report Creation in Excel.
Dashboard Templates