MEDIAN function in Excel for performing statistical analysis
MEDIAN function in Excel is used to analyze a range of numeric values and returns a number that is the midpoint of the set being examined. That is, this function conditionally divides the set of numbers into two subsets, the first of which contains numbers less than the median, and the second - more. This is one of several methods for determining the central trend of the range studied.
Examples of using the MEDIAN function in Excel
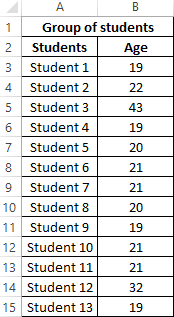
Example 1. In the study of age groups of students used data from a randomly selected group of students in the university. The task is to determine the average age of students.
Initial data:
The formula for calculating:
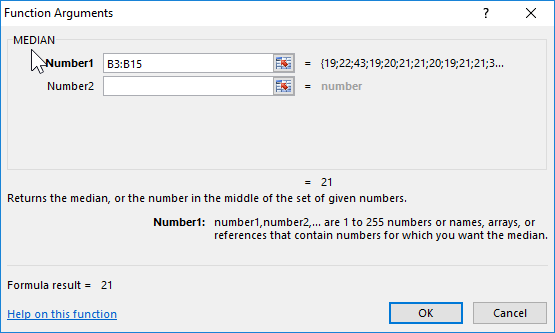
Argument Description:
- B3:B15 - the range of the investigated ages.
The result:
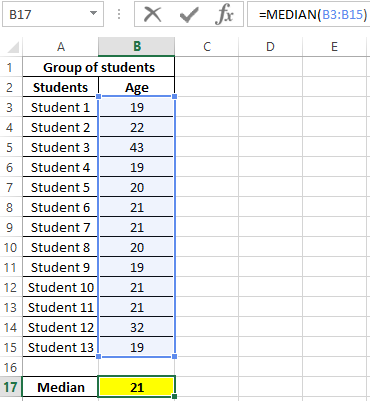
That is, there are students in the group whose age is less than 21 years and more than this value.
Comparison of MEDIAN and average functions to calculate the average
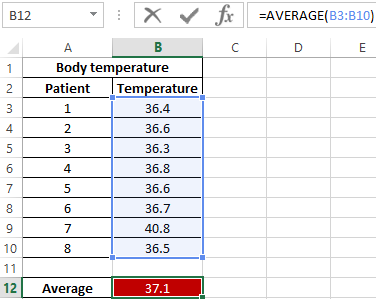
Example 2. During the evening tour in the hospital, each patient was measured body temperature. Demonstrate the feasibility of using the parameter median instead of the average value for the study of a number of values obtained.
Initial data:
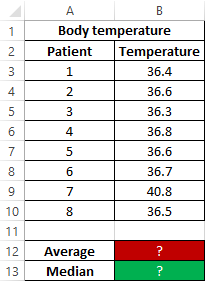
The formula for finding the average value:
The formula for finding the median value:
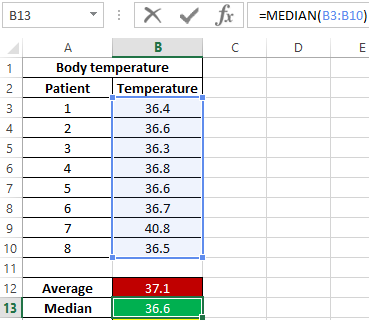
As can be seen from the average value, the average temperature in patients is above the norm, but this is not true. The median shows that at least half of the patients have a normal body temperature that does not exceed 36.6.
Attention! Another method for determining the central trend is fashion (the most common value in the range under study). To determine the central trend in Excel, use the MODE function. In this example, the values of the median and the mode are the same:
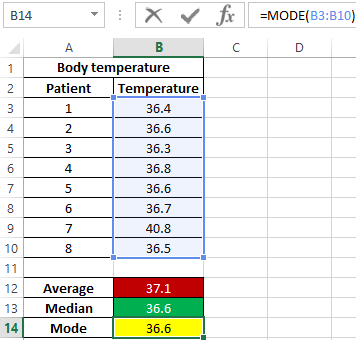
That is, the median value dividing one set into subsets of smaller and larger values is also the most frequently occurring value in the set. As can be seen, in most patients the temperature is 36.6.
Example of calculating the MEDIAN for statistical analysis in Excel
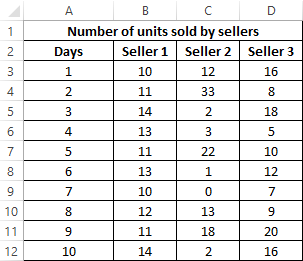
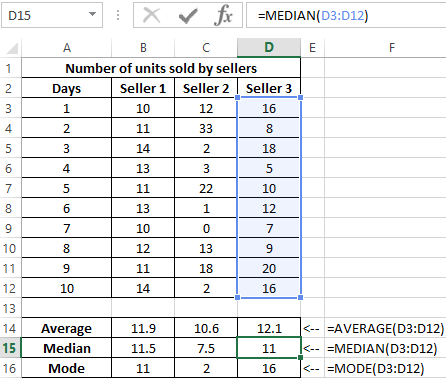
Example 3. The store has 3 sellers. According to the results of the last 10 days, it is necessary to determine the employee who will receive the award. When choosing the best employee, the degree of effectiveness of his work, and not the number of goods sold, is taken into account.
Source data table:
To characterize the efficiency, we will use three indicators at once: the average value, the median and the mode. We define them for each employee using the formula AVERAGE, MEDIAN and MODE, respectively:
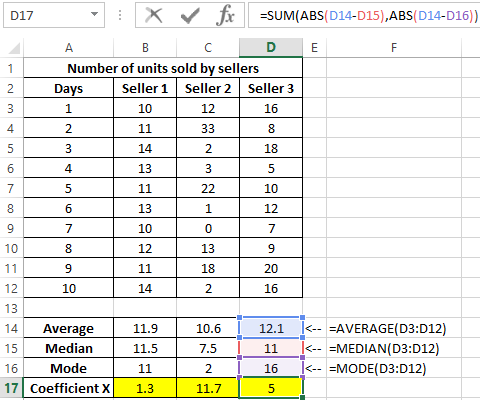
To determine the degree of scatter of data, we use a value that is the total value of the modulus of the difference between the mean and the mode, the mean and the median, respectively. That is, the coefficient x = | av-med | + | av-mod |, where:
- av is average;
- med is median;
- mod is a mode.
Calculate the value of the coefficient x for the first seller:
Similarly, we will carry out calculations for the remaining sellers. Results:
Determine the seller to whom the bonus will be issued:
Note: the SMALL function returns the first minimum value from the considered range of x values.
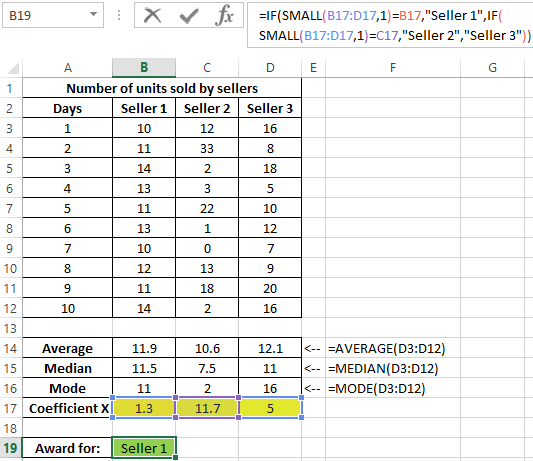
The coefficient x is a quantitative characteristic of the stability of the work of sellers, which was introduced by the economist of the store. With its help, it was possible to determine the range with the smallest deviations of values. This method demonstrates how three methods of determining the central tendency can be used at once to obtain the most reliable results.
Features of using the MEDIAN function in Excel
The function has the following syntax:
=MEDIAN(number1,[number2],...)
Argument Description:
- number1 is a required argument characterizing the first numerical value contained in the range under study;
- [num2] - optional second (and subsequent arguments, up to 255 arguments in total), characterizing the second and subsequent values of the studied range.
Notes 1:
- When calculating, it is more convenient to transfer the whole range of values under investigation instead of sequentially entering arguments.
- Arguments are data of a numeric type, names containing numbers, data of a reference type, and arrays (for example, =MEDIAN({1,2,3,5,7,10})).
- The calculation of the median takes into account cells containing empty values or logical TRUE, FALSE, which will be interpreted as numerical values 1 and 0, respectively. For example, the result of executing a function with logical values in arguments (TRUE,FALSE) is equivalent to the result of executing with arguments =MEDIAN(1,0) and is equal to 0.5.
- If one or more function arguments take text values that cannot be converted to numeric values, or contain error codes, the result of the function is the error code #VALUE!.
- Other Excel functions can be used to determine the median of the sample: PERCENTILE.INC, QUARTILE.INC, LARGE examples. Examples:
- =PERCENTILE.INC(A1:A10,0.5), since by definition the median is the 50th percentile.
- =QUARTILE.INC(A1:A10,2), since the median is the 2nd quartile.
- =LARGE(A1:A9,COUNT(A1:A9)/2), but only if the number of numbers in the range is an odd number.
Notes 2:
- If in the studied range all numbers are distributed symmetrically with respect to the average value, the arithmetic mean and median for this range will be equivalent.
- With large deviations of data in the range ("spread" of values), the median better reflects the trend in the distribution of values than the arithmetic average. An excellent example is the use of a median to determine the real level of wages among the population of a state in which officials receive an order of magnitude more than ordinary citizens.
- The range of tested values may contain:
Download examples MEDIAN function in Excel
- Odd number of numbers. In this case, the median will be a single number dividing the range into two subsets of large and small values, respectively;
- Even number of numbers. Then is calculated as the arithmetic average for two numerical values dividing the set into the two subsets indicated above.

Data Visualization Charts for Interactive Report Creation in Excel.
Dashboard Templates