Calculation of break-even point with examples in Excel
The break-even point reflects the volume of production and sales of goods and services which cover all the costs of the enterprise. In the economic sense, it is an indicator of a critical situation when profits and losses are zero. This indicator is expressed in quantitative or monetary units.
The lower the break-even point of the volume of production and sales, the higher the solvency and financial stability of the firm.
Breakeven point formula in Excel
There are 2 ways to calculate the breakeven point in Excel:
- Monetary equivalent: (revenue*fixed costs) / (revenue - variable costs).
- Natural units: fixed cost / (price - average variable costs).
Attention! Variable costs are taken from the calculation per unit of output (not common).
To find break-even you need to know:
Fixed costs (independent of the production process or sale). This is lease payments, taxes, salaries for management, leasing payments, etc.
Variable costs (depend on production volumes). This is the cost of raw materials, utility bills for the use of energy resources on production facilities, wages of workers, etc.
The selling price of a unit.
We will enter the data in the Excel table:

Tasks:
- Find the volume of production in which the company will receive a net profit. Establish a relationship between these parameters.
- Calculate the volume of sales which will perform breakeven.
We compile the following table with the formulas to solve these tasks:

- Variable costs depend on the volume of output.
- Total costs are the sum of variables and fixed costs.
- Income is the product of the volume of production and the price of the goods.
- Marginal revenue is a gross income without variable costs.
- Net profit is income without fixed and variable production costs.
Let's fill in the table and see what output will help the enterprise ensure cost recovery.

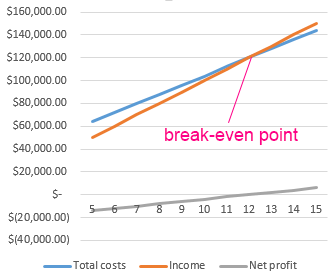
Since the 13th output, net profit has become positive. And in the break-even point, it is equal to zero. The volume of production is 12 units of goods. And the sales revenue is 120,000$.
How to make the graph for break-even point in Excel?
We will draw up a graph for a clear demonstration of the economic and financial condition of the enterprise:
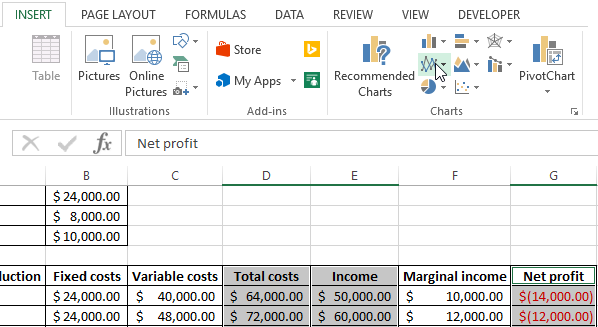
- Select range "Total costs", "Income", "Net profit" and select: «INSERT»-«Charts»-«Insert Line Chart»
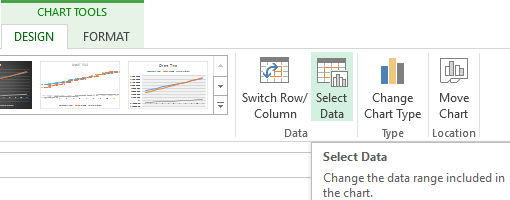
- Click on chart and choose the look of the graph and click: «CHART TOOLS»-«DESIGN»-«Data»-«Select Data» on the button.
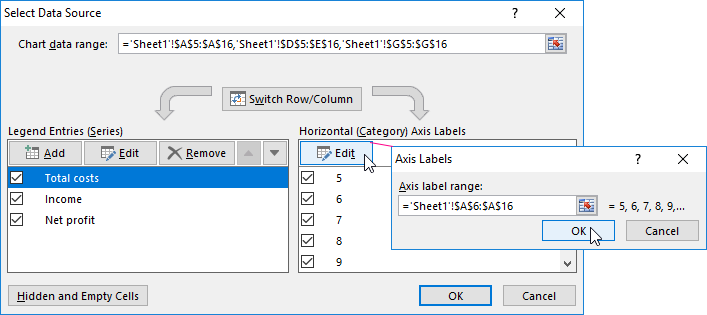
- For the demonstration, we need the columns "Total costs", "Income", "Net profit". These are the elements of the legend which called "Series". We manually enter the "Series name ". And in the "Series value" line make a reference to the corresponding column with the data.
- The range of horizontal axis titles is "Production Volume".
We obtain a graph of the next look:
Let's change the chart a little (Chart Styles):
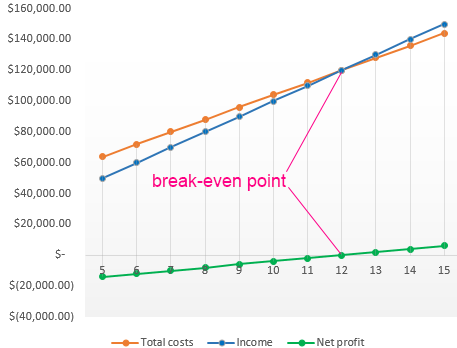
Such a demonstration allows you to see that the net profit at the breakeven point really equals "zero". And after the twelfth output cycle, we were "in the black".
Where such calculations are needed
The "breakeven point" indicator is in demand in economic practice for the solution of the following tasks:
- Calculation of the optimal price for the product.
- Calculation of the total costs at which the firm still remains competitive.
- Drawing up a plan for the sales.
- Finding the volume of output which will yield profitability.
- Analysis of the financial position and solvency of the enterprise.
- Finding the minimum amount of production.
The results of such calculations are claimed by both internal and external users. The break-even is taken into account when making management decisions and gives an idea of the financial position of the firm. The use of such a model is a way of assessing the critical level of the production volume and the sale of goods and services.
Ready-made calculations and templates for analyzing the output of the enterprise to break-even:
- Download this example calculation break-even point;
- Download an simple of calculation of the break-even point of production;
- Download the calculation of the break-even point of the store;
- Download the form for the calculation of the break-even point;
- Download examples of solving the problem of calculating the break-even point.
Done!
