Amazon Affiliate Expenses Tracker Template Download
Online commerce and digital marketing have already secured an indispensable place in our lives. More and more retail consumers prefer to purchase goods online, even if it means paying extra for delivery. After all, the cost of parking and the time spent wandering through supermarkets now outweighs the price of having products delivered from an online store. That's why massive platforms like Amazon will continue to produce new entrepreneurs for online trading regularly. In fact, almost everyone has the opportunity to sell products through Amazon. What does an online entrepreneur need? First and foremost, customers, but it's equally important to manage the business without incurring expenses on employees. A modern online entrepreneur is a lone wolf, battling in the business arena. In a world of eight billion people, everyone competes for their slice of the pie. And in the competitive struggle, the one who loves their business the most should always emerge victorious. Visualizing data about the promotion of products on Amazon allows you to wholeheartedly embrace your business!
How to make Affiliate Marketing Analysis in Excel
Visualization is always the embellishment of data, and it's impossible not to love beauty. If over time, your business has become mundane due to dry calculations, add data visualization to them. As a result, your strategy will come to life with new colors. As an example, we present to you a dashboard for analyzing promotion on Amazon.
Amazon Affiliate Marketing Dashboard Structure
This version of the tool panel contains many interactive data visualization controls. Therefore, 3 user interface screens were initially developed:
- BUDGET.
- CHANNELS.
- COMPARE.
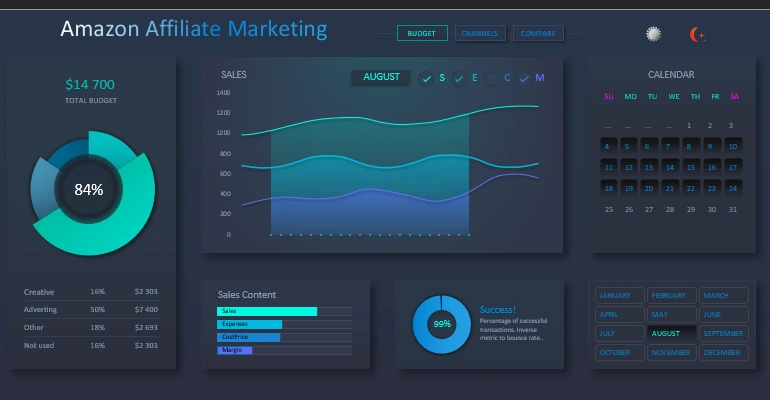
Analysis of Advertising Budget Spending
This template is created in MS Excel. It does not contain macros but offers useful interactive features. It includes segmenting indicators, data selection for the accounting period, and comparative analysis using graph curves, among others.
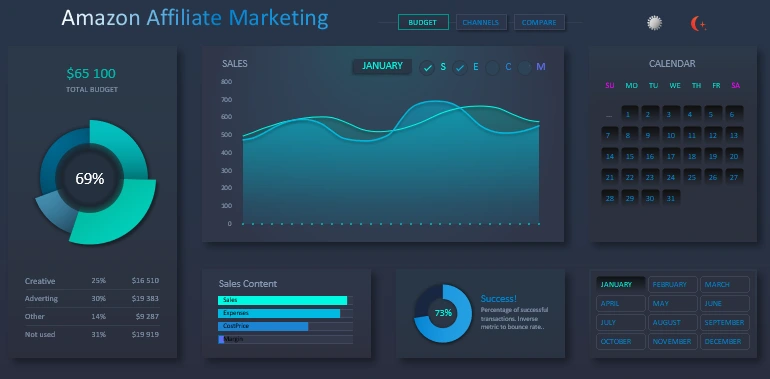
On the main "BUDGET" dashboard page, you'll find a summary of expenditure on advertising campaigns. On the right, there's a breakdown chart of expenses for customer acquisition channels. In the center, you can compare curves for different key indicators:
- S – Sales
- E – Expenses
- C – CostPrice
- M – Margin
In the lower left block, you can see the rating of these indicators, sorted in descending order. On the right, in the bottom block, you'll find an overall assessment of success in the currently selected accounting period. You can select data for a specific period using the interactive controls on the panel on the right side of the dashboard. In the upper right corner (above the calendar), there are buttons for switching the interface design to day and night mode for your convenience.
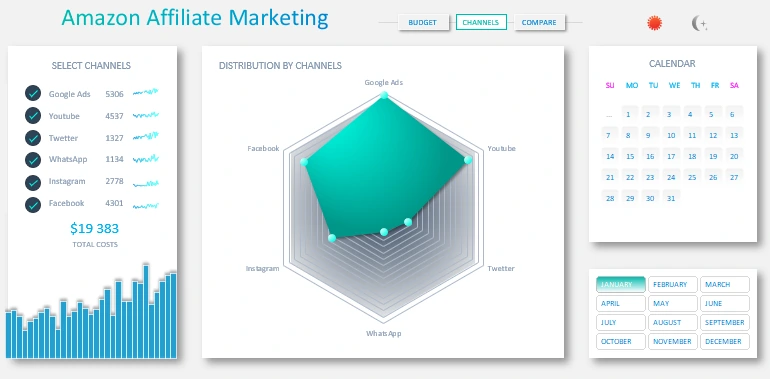
Analysis of Customer Acquisition Results by Source Channels
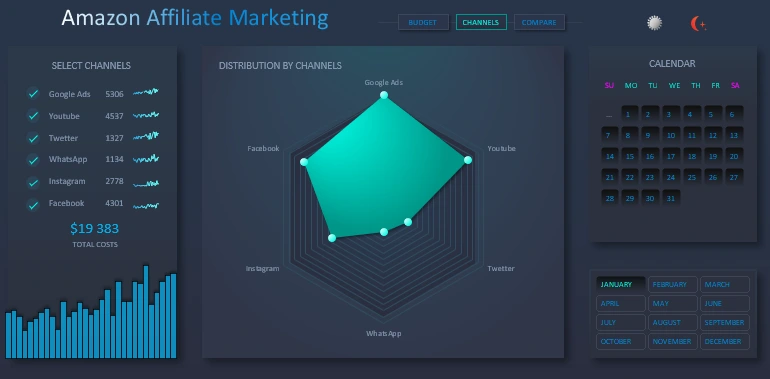
The left side of the dashboard displays a summary of channel performance.
The list of customer acquisition source channels through advertising campaigns includes:
- Google Ads
- Youtube
As a result of investing in each channel, there's a brief summary of how much has been spent and what activity has been gained. It is schematically represented in preliminary visualizations – sparklines.
Below the list, you'll find the total expenditure of $19,383 and a summary graph of daily activity for 1 month.
In the central block, you can observe the distribution of indicators across different communication channels and interactions with potential customers.
You can control data selection for visualization using the "Calendar" panel.
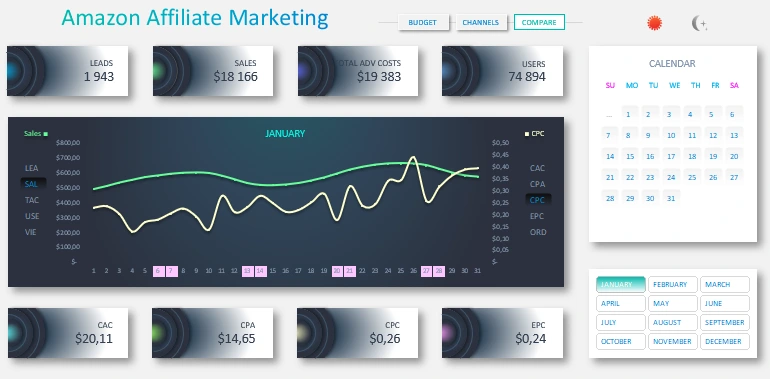
Comparative Analysis of Key Performance Indicators
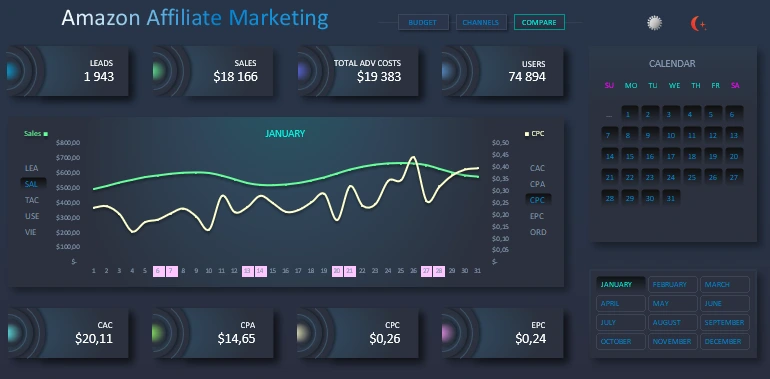 The final dashboard screen performs a comparative analysis of the curves of key performance indicators for affiliate marketing:
- Number of leads;
- Sales volume;
- Total advertising expenses;
- Reach of potential buyers;
- Cost per customer acquisition;
- Action cost;
- Cost per ad click;
- Average income from ad click.
For user convenience, two interface color schemes are offered: dark and light.
Simplified version interface skins:
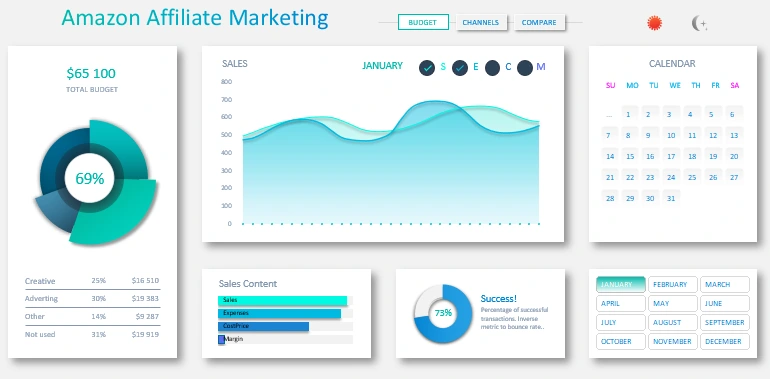
Overall, this presentation template can be a good starting point for integrating data visualization into a small business on Amazon:
 Download the Amazon Affiliate Marketing Information Panel in Excel
We live in an era of overproduction, so don't believe anyone who says that a good product doesn't need advertising or that a good product should sell itself. This is a myth and misconception! As long as there is money, there will be advertising. Money doesn't come from printing presses; it comes from sales! And to make a deal, you first need to create an offer for the market. Without an offer, demand is impossible. Advertising creates that offer; advertising creates money.

Data Visualization Charts for Interactive Report Creation in Excel.
Dashboard Templates