How to analyze or present KPI for startup projects in Excel
A good start-up project is not enough! It is important to properly analyze and present it. Many successful start-up projects were sold for next to nothing because their presentations were not understood. In analytics, even the best idea is worth nothing, the cost of its implementation is always important!
Presentation of Start-Up project data visualization in Excel
The goal of every startup project is to create a high-demand product with high value for its consumers. Each successful product in its life cycle goes through 4 stages of its use:
- Innovation
- Luxury.
- Entertainment
- Household utensils.
Analysis of startup project data on an Excel dashboard
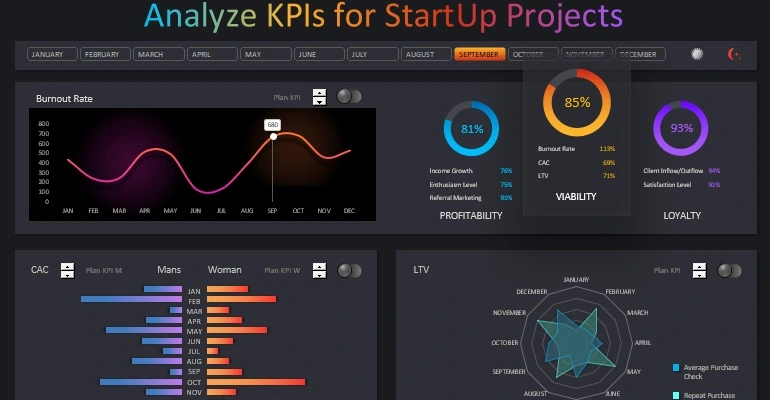
Your attention is invited to a prototype dashboard for the analysis and presentation of key indicators in startups. It allows you to analyze all the most important KPI indicators.
KPIs that startups often track:
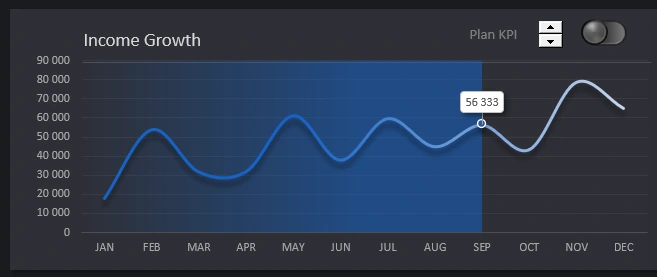
- Revenue Growth:
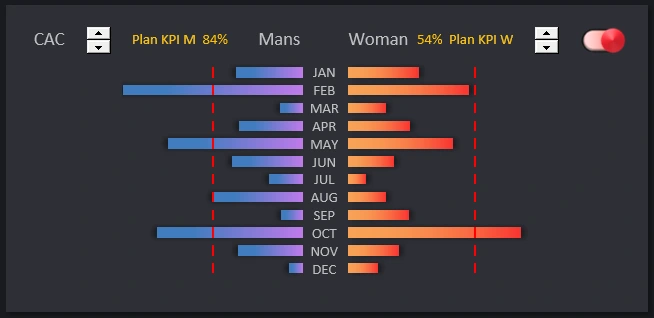
- Customer Acquisition Cost (CAC):
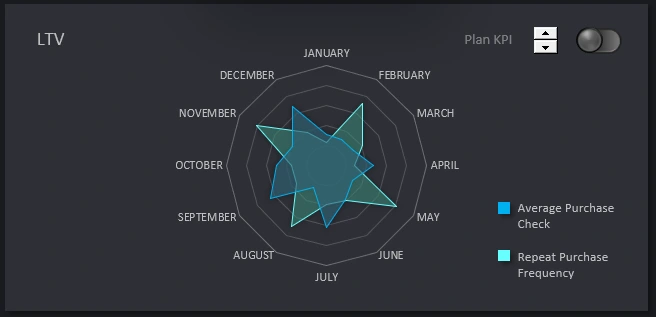
- Customer Lifetime Value (CLTV or LTV):
- Monthly Recurring Revenue (MRR):
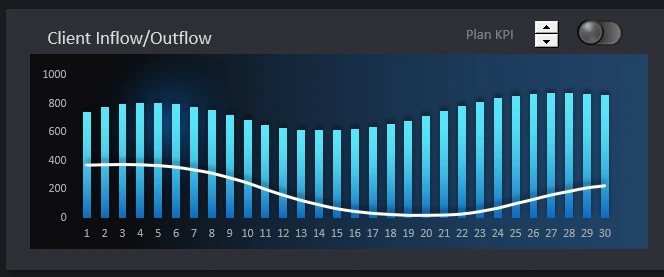
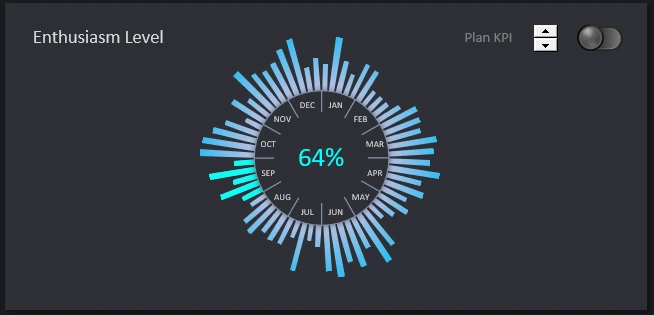
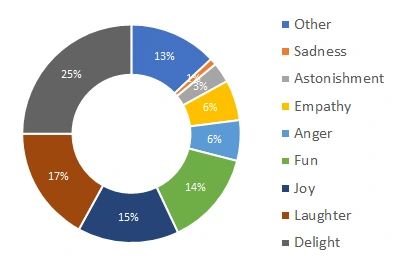
- User Engagement Metrics:
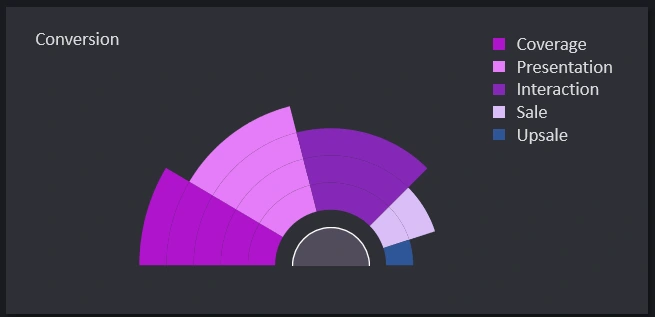
- Conversion Rate:
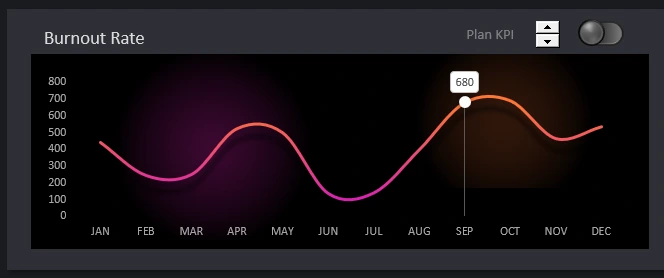
- Burn Rate:
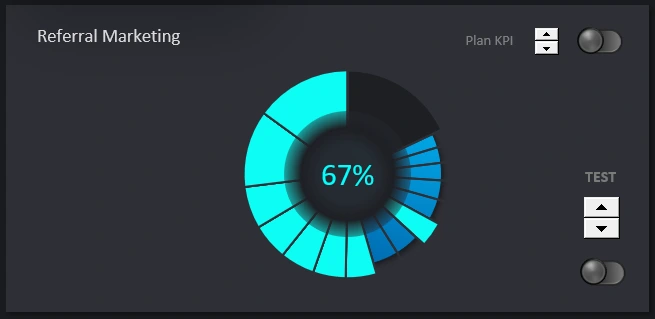
- Virality Coefficient:
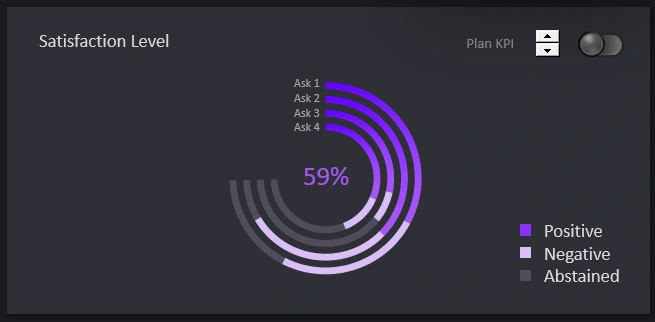
- Net Promoter Score (NPS):
These are just a few examples of KPIs that startups commonly track. It's important for each startup to identify the specific KPIs that align with its business objectives and industry dynamics.
 Download start-up project KPI analysis presentation in Excel

Data Visualization Charts for Interactive Report Creation in Excel.
Dashboard Templates