EBITDA Formula Calculation Excel Spreadsheet Template on Chart
The financial indicator EBITDA allows us to quickly assess the level of profitability of investment projects. On the sidelines of financiers, it is also called the most popular "dirty profit" indicator. It is indispensable for batch analysis of a large number of proposals for investors and creditors. For example, the coefficient of the optimal debt load of the enterprise should not exceed 3 (or better <2.5). This ratio is calculated using EBITDA, using the formula:
Leverage Ratio = loan amount / EBITDA
This approach resembles a scoring system in banking programs for automatic analysis and decision-making on a large number of short-term loan applications. Or for technical screening of stocks and companies. For long-term loan analysis, this financial indicator does not work. These and other advantages and disadvantages of the most popular dirty profit indicator will also be discussed further on examples.
An example of the formula for calculating EBITDA from a firm's balance sheet
EBITDA (Earnings Before Interest, Taxes, Depreciation and Amortization) is earnings before interest, income taxes and depreciation of assets.
There are two basic formulas for its calculation:
- The simple and reliable method is Top-Down.
- A complicated, theoretical method - Bottom-Up.
EBITDA = Operating profit + Depreciation expense for fixed assets + Depreciation expense for intangible assets
EBITDA = Net income + Interest expenses + Corporate income taxes + Depreciation and amortization of fixed and intangible assets.
Example of EBITDA calculation:
| Consolidated statement of profit or loss for the year ended 31 december (except for earnings per share data) | ||
| Year | 2017 | 2016 |
| Gold sales | 2684 | 2429 |
| Other sales | 37 | 29 |
| Total revenue | 2721 | 2458 |
| Cost of gold sales | 969 | 891 |
| Cost of other sales | 31 | 28 |
| Gross profit | 1721 | 1539 |
| Selling. general and administrative expenses | 211 | 151 |
| Other expenses. net | 55 | 27 |
| Operating profit | 1455 | 1361 |
| Finance costs. net | 200 | 145 |
| Interest income | 28 | 40 |
| Gain on investments and revaluation of derivative financial instruments | 118 | 119 |
| Foreign exchange gain. net | 130 | 396 |
| Profit before income tax | 1531 | 1771 |
| Income tax expense | 290 | 326 |
| Profit for the year | 1241 | 1445 |
Operating activities
| Consolidated statement of cash flows for the year ended 31 december | ||
| Year | 2017 | 2016 |
| Profit before income tax | 1531 | 1771 |
| Adjustments for | ||
| Finance costs. net | 200 | 145 |
| Interest income | 28 | 40 |
| Gain on investments and revaluation of derivative financial instruments | 118 | 119 |
| Depreciation and amortisation! | 178 | 148 |
| Foreign exchange gain. net | 130 | 396 |
| Other | 23 | 22 |
| Total: | 1656 | 1531 |
- EBITDA "Bottom-Up" = Operating Income + Depreciation = 1455 + 178 = 1633.
- EBITDA "Bottom-Up" = Net Income + Interest Expense + Corporate Profit Taxes + Depreciation of Fixed and Intangible Assets = 1241 + 200 + 290 + 178 = 1909
As we can see, the values calculated by the two methods diverge quite a bit When we calculate the bottom-up method, we capture a lot of one-time items not related to the company's core business.
Advantages and disadvantages of financial EBITDA
Advantages:
- It is generally accepted that EBITDA is not bad at showing "cash profit" from a company's core business option.
- It is comfortable to use in comparison with companies operating in the same industry. With all this, it does not matter the size of investment (fixed assets), size of the debt burden, and tax treatment of companies. Or it does not provide for the tax treatment of the country in which a company is established, capital structure and accounting policy.
- Used not only in the evaluation of companies, but also in credit and financial analysis.
- Allows us to estimate the amount of debt that is optimal for a company. It also gives an approximate investment risk.
- In a "good faith" calculation, the ratio appears reliable. It does not allow for manipulation of internal reporting data. For example, if the firm decided to overestimate depreciation, by the same amount - the net income will decrease and depreciation will increase. Consequently, only the design of the indicator will change, but not the final result.
Disadvantages:
- Firms can easily manipulate metrics for the sake of measuring EBITDA quality, apply different calculation techniques or adjustments. Consequently, it is necessary to be more scrupulous to understand how the ratio was collected and at what point in time of analysis.
- Firms with high debt overhang often end up in an attractive position as a result. Nevertheless, profits will still be inferior to firms with less debt A similar situation exists with depreciation.
- Does not reproduce the need for future investment in the company. This suggests that when comparing companies from different areas of activity, the winners will be those who have a large proportion of fixed assets.
What needs to be emphasized here is that EBITDA is presented as the primary indicator for screening companies. After the initial screening, the company requires more detailed scrutiny.
For example, Warren Buffett does not use EBITDA at all when evaluating the success of companies. But to be fair, it's worth noting right away that Warren Buffett only considers long-term investment projects of 10 years or more. And he is not in the business of screening companies; he is interested only in a scrupulous, detailed and thorough financial analysis.
Also, such giants as Wal-Mart, General Electric or Microsoft have abandoned this financial indicator and never use it in their financial statements.
Example of using EBITDA in Excel for visual analysis
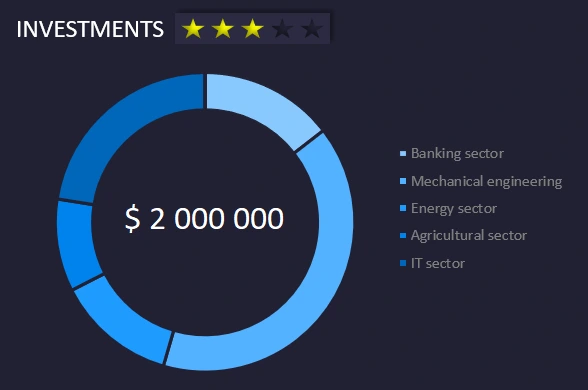
Let's simulate a situation for an example. An investment portfolio of 5 investment items in the top 5 economic sectors by capitalization in the world was compiled for a $1,000,000 investment:
- Banking sector.
- Machine building sector.
- Energy.
- Agro-industrial.
- Information technology.
All of these sectors in the numbered list above are arranged in descending order of capitalization according to statistics as of today.
Investment term of 5 years with monthly investments and annual doubling of investment capital accumulation. Throughout the period, each investment object collects its own statistics:
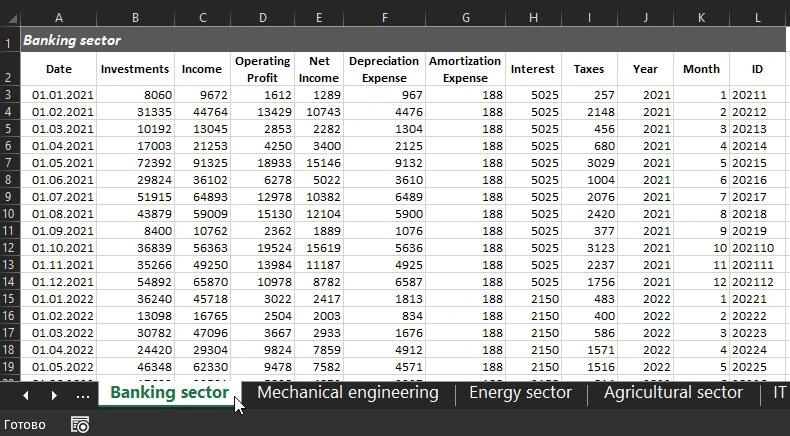
Each year, shares of investment capital are reallocated to different sectors depending on the performance of the invested funds and the formulation of a new strategy for the following year. The last block in the presentation in the lower right corner shows how investment resources have been allocated to sectors of the economy. For example, in the year 2022:
The asterisks show the performance of investments according to a 5-point evaluation system in relation to the highest investment return received in the last 5 years. If necessary, the evaluation system can be changed, for example, according to the best ROI for the same period. To do that, adjust the formulas on the "Processing" worksheet in the range of cells D4:H4, as shown in the figure below:
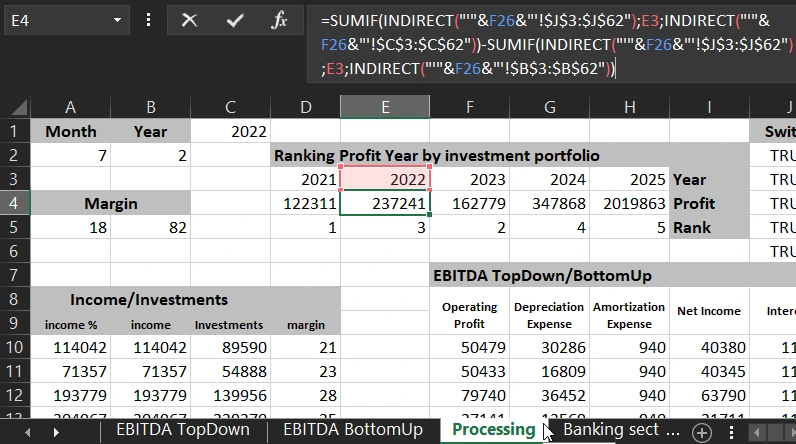
The Processing worksheet contains all the formulas for processing the values obtained from the raw data sheets and subsequent output to the interactive presentation visualization in Excel.
It is also possible to evaluate the success of an investment by the return margin of the invested capital. For example, in the first block of the dashboard (upper left corner) there is a chart symbolizing the share of margin for each month of the selected year:
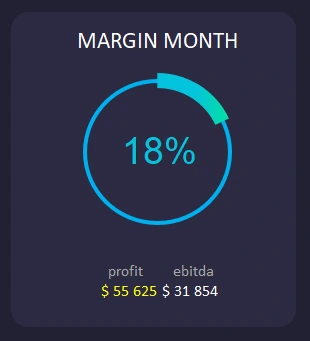
The two values at the bottom are for comparing the amount of profit and EBITDA in the current month.
In the second block of the dashboard (top center) is a graph of monthly investments:
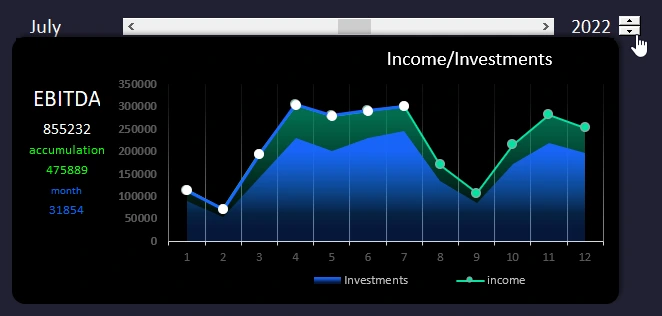
There are 2 curves on the chart:
- Investments - the total amount invested in the current months.
- Income - the amount of investment proceeds in the same months.
On the left side of the block are a few more values:
- Annual EBITDA for the currently selected year (for example, in the picture 2022).
- Accumulation - This is the accumulation of revenue by months (i.e.: with each new month the amount increases).
- Month - revenue in the current month.
There are also 2 dashboard controls in this block:
- Counter style button - for switching between years.
- A scroll bar that performs 2 functions:
- Switching between months;
- control of the informative blue line cursor with white dots on the chart.
Below under the second block is block number 4:
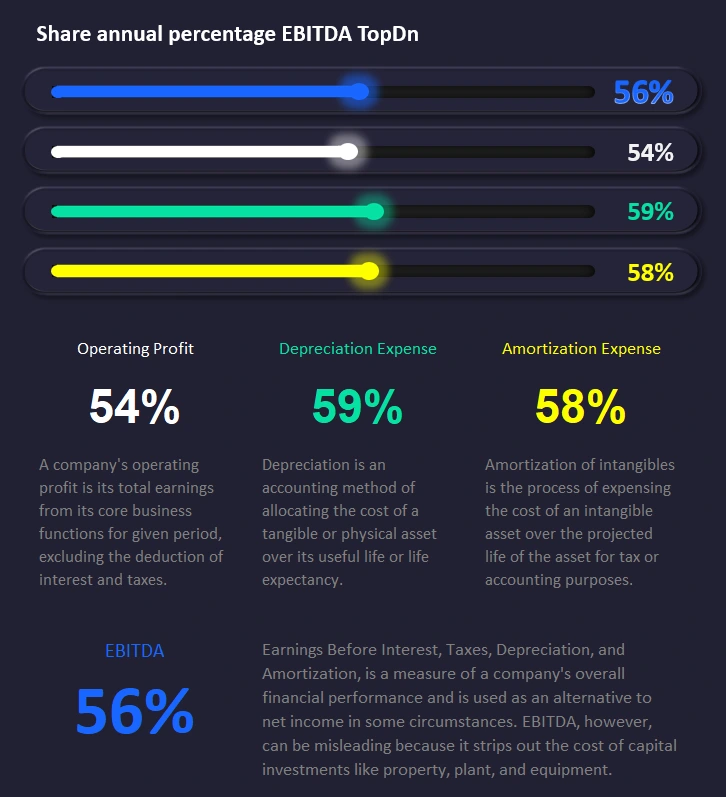
Here we track the comparative changes in all the key indicators for the EBITDA formula in a simple top-down type of way in each month.
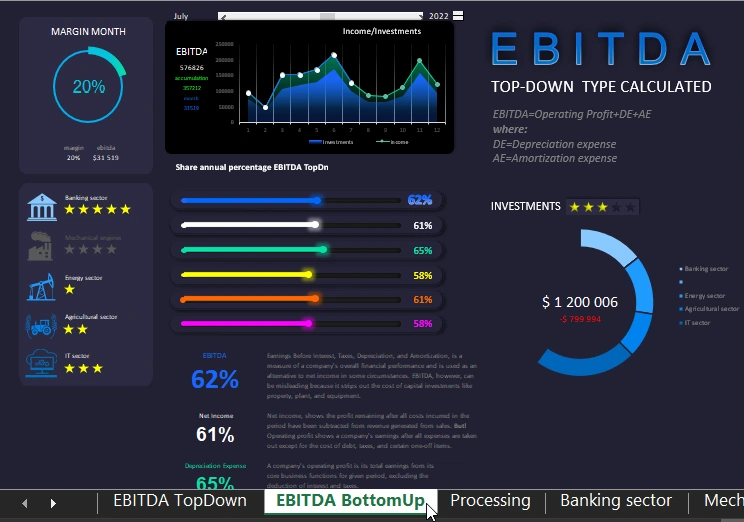
Finally, let's look at another very important block of presentation with controls:

Here is a block of informative buttons to disable a group of indicators individually. For example, to analyze the performance of an investment portfolio while excluding one or more economic sectors. This allows you to understand how the situation would change for a given portfolio if you did not invest in certain economic sectors. Each economic sector pictogram has a rating scale against it, using a 5-point system. In other words, it assesses how the investments in one sector or another have performed.
This Excel template also contains another dashboard for the same investment portfolio analysis, but using another complex EBITDA formula - from bottom to top:
 Download Dashboard for Investment EBITDA Analysis in Excel
The second dashboard is almost the same, but it has more indicators to analyze in the fourth block as it is required by the more complex bottom-up EBITDA calculation formula. Also, some charts and graphs refer to other values on the Processing sheet, because the calculations are based on a different formula.

Data Visualization Charts for Interactive Report Creation in Excel.
Dashboard Templates