Excel Payroll Dashboard Example for Invest in Employees
Salaries and employee bonuses represent the largest expense category in any business. This makes them the primary object of internal investment and the key driver from which return on invested capital should be expected. Any business is an investment asset not only for investors, but also for the business owner and even for its employees. An Excel dashboard template for analyzing payroll efficiency helps visually track the relationship between compensation and the tangible outcomes of financial investments. It also helps identify the most effective patterns and growth points to fully answer the question: “where exactly should financial flows be directed for scaling, and where for maintaining stability and sustainability of the system?”
Key Benefits of the Excel Payroll Analysis Dashboard

The primary purpose for the practical application of this dashboard template is teaching Excel capabilities in developing dashboards to track payroll efficiency.
Data on the dashboard is segmented into three categories:
- Production Department Masters.
- Office Staff.
- Sales Department Representatives.
This template is designed for analyzing the operations of a small team of 17 employees in a small business. Although 17 people on staff by modern standards is not always a small business.
For example, when Twitter was valued at $104 million, it had only 18 team members. And $100 million represents a large systemic player in the market—just very compact and super-efficient due to low payroll expenses.
Furthermore, in 2012, when Instagram was acquired by Facebook for $1 billion, it had only 13 employees.
One can also recall WhatsApp. In 2014, Facebook bought them for $19 billion. At that time, the company employed only 55 people.
And considering today's reality of hyper-automation—where in 2026, a company called Medvi was created with two employees and an annual turnover of $1.8 billion—employee headcount no longer defines whether a business is large, medium, or small.
This template can serve as a great source of inspiration or a prototype for human resource investment management software at the startup stage of future companies.
Please note! The potential embedded in this concept possesses a range of interconnected functions between payroll expenses and feedback in the form of sales results.
List of advantages of the Excel payroll fund management dashboard:
- Segmentation of payroll data by categories.
- Efficiency analysis of the bonus compensation system for motivation.
- Tracking the achievement of pragmatic goals affecting employee satisfaction.
- Weekly budgeting and budget expense analysis by days of the week.
- Segmentation of sales volume across different points of sale.
- Formulas for identifying sales growth points directly on a line chart.
- Daily activity analysis using a 4-point system throughout the calendar month.
Supportive HR metrics are also used:
- working time balance;
- workload across different teams;
- comparative budget analysis by employee categories.
Next, let's take a closer look at all the interactive data visualization blocks in Excel.
Salary and Bonus Distribution per Employee on a Radar Chart

The chart represents all company employees. It shows how salaries and bonuses for exceeding KPI plans are distributed among them. For some workers, bonuses play a more significant role than base salary, such as for sales representatives.
The wide orbit ring in the background clearly shows the upper budget limits. If a level crosses the orbit zone, it requires attention for more detailed analytics—for instance, how rational it was to reward staff so highly and how the investments made by the company in their efforts are returning.
In this image example, it is evident that all bonuses are within the ring, suggesting the KPI plan is very well thought out. Base salaries for some employees, however, are approaching the allowable budget boundaries.
For user convenience, the dashboard allows toggling the salary distribution area or the bonus shape on/off. To do this, simply click on the chart legend labels. The color scheme thumbnails and legend labels of the Radar chart function as buttons in this customized style.
Dashboard Screen for Detailed Salary and Bonus Analysis
For a more convenient analysis to maximize immersion and focus, select the corresponding menu item in the dashboard's main menu called: "Salary & Bonuses." This will open a dashboard screen for detailed Radar chart analysis in a large format:

Use the button block in the top right corner of the dashboard, as seen in the image. If you disable one of the employee categories, the data visualization values on the Radar chart will be filtered. As a result, one of the three segments will be excluded.
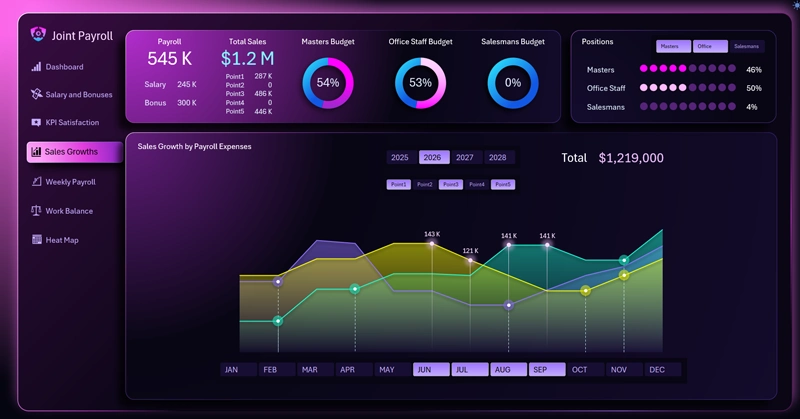
Sales Growth Chart for Comparative Analysis by Points of Sale

Line charts are excellent for comparative analysis—provided there aren't too many in one block! When you need to compare 5 sales metrics across different points of sale simultaneously, it is better to use filter buttons to disable extra lines. This helps avoid visual noise.
The chart also shows growth points. They are built using a specific Excel formula algorithm. Each point is a transition point where dynamics move into growth. The result is an oscillator for analyzing trends on the chart. As soon as the chart plots dynamic changes in a growth direction after a sideways movement or a decline, the user immediately notices the signal and can begin analyzing what exactly influenced this effect. Next, they should look for cause-and-effect relationships across all visualizations to understand what became the driver for sales growth, and then scale those processes and the business as a whole.
Also used in this block are cursors for exposing selected accounting periods. Instead of labels on the X-axis for month names, the chart uses buttons to indicate the choice of months for analysis. The authority of this button block extends across the entire dashboard for switching months in all data visualization blocks.
The button block functions (similar to a pivot table slicer) allow selecting multiple months simultaneously or grouping them to use other accounting periods, such as quarters, half-years, or sales seasons. All data on the dashboard will update automatically and accordingly.
Sales Growth Analysis Screen
Here you can dive into a detailed comparative analysis of sales growth across different points of sale. It is comfortable to track growth points across various accounting periods.
Please note! Even when selecting three charts in one block, visual load is felt. If you select all 5 objects, analysis becomes nearly impossible under such conditions of visual noise.
Important to consider! The button block for enabling or disabling sales chart lines for different points of sale has limited authority; its functionality does not extend to the entire dashboard. These buttons only have an interactive influence on the line chart. These point-of-sale buttons have no relation to other charts and do not interact with them in any way.
Combined Bar Chart with Budget Data Grouping
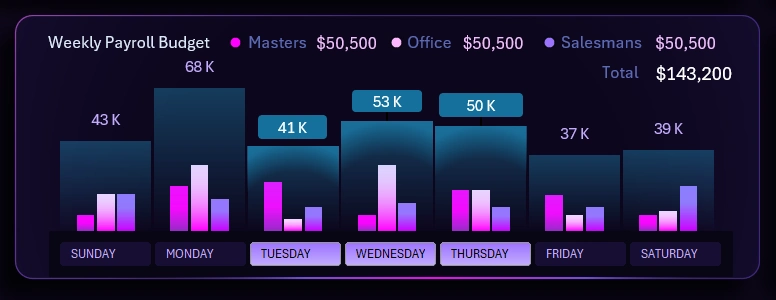
This block analyzes the volume of weekly budget expenses across different days of the week for different employee categories.
Each large bar represents a group of three internal small bars. These three internal mini-bars correspond to budget metrics for three employee categories:
- masters;
- office staff;
- sales reps.
In this way, we can perform parallel analysis across two reporting planes simultaneously to:
- Evaluate the overall expense picture on a specific day of the week.
- Determine which category had the greatest impact on the total budget expense size on specific days of the week.
Under the large bars, instead of labels, there are interactive buttons for exposing selected days for analysis. Data can also be grouped—for example, to select only workdays or only weekends, as well as any other specific conditions matching internal corporate reporting culture, taking into account the specifics of the company's directions and type of activity.
Important to note! The authority of this button block is limited to this interactive bar chart and does not extend to other visualization blocks.
Expense Analytics Screen for Employee Category Budgets by Day of the Week
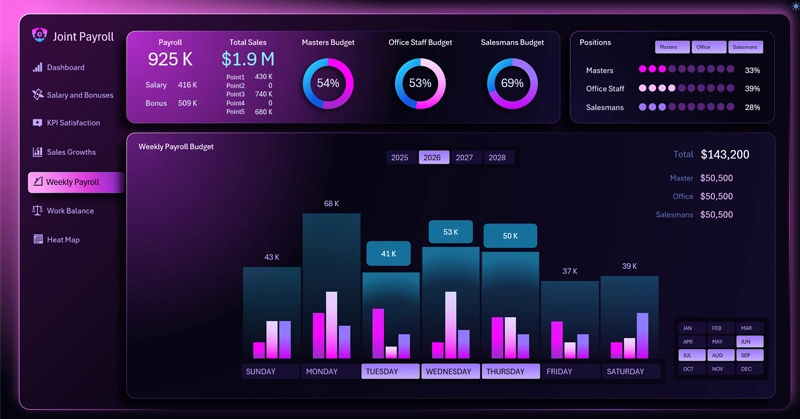
The table on the right provides summary information about the days selected for analysis on the bar chart. If you disable an employee category using the button block in the top right corner, the small bars corresponding to the excluded category will disappear from the chart. The large bars will become slightly smaller minus the excluded data points. The summary table on the right will also update its data automatically and accordingly.
Analysis of Achieving Personal Employee Satisfaction Goals
This is a non-standard visualization block for dashboards, but HR specialists will understand it correctly. A company does not need non-pragmatic workers because they are impossible to manage. It sounds harsh, but I will try to explain everything now.
This issue becomes particularly acute when a salary exceeds $50,000 per year and it becomes difficult to motivate the individual with money alone.
Every person should have not only high goals for the soul but also pragmatic goals for the body and spirit. When a person does not know which port they are heading for, no wind will be favorable.
The psyche lives not in the soul or consciousness, but in the body, and all of this must be managed daily under the influence of various external triggers. To maintain focus, it is important to have a guiding star—or better, two: one for the soul and another for the spirit. It is always good when a company is able to let its employee close two types of goals:
- Goals at the level of consciousness and soul. For example: career growth and self-actualization—the ability to market oneself to meet needs for status, social demand, and belonging.
- Goals at the level of body, spirit, and psyche. For example: a house, a car, hobbies, rest, and travel—effective means and resources for restoring physical and emotional health.
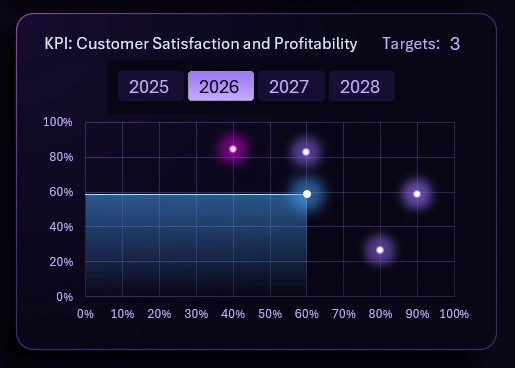
How to read the pragmatic goal achievement chart?
Each goal has two basic indicators:
- Importance level – values on the Y-axis.
- Satisfaction level – values on the X-axis.
The stars on the chart determine where these goals are located relative to the levels of importance and satisfaction. The further a goal is from the zero value (the intersection of the axes), the longer it takes to achieve. The more goals achieved, the more the fill on the chart grows. If more goals are achieved along the X-axis, the fill grows more actively along the X-axis, making it easier to reach subsequent goals in the X direction. The fill on the chart behaves similarly along the Y-axis.
KPI Fulfillment Screen for Employee Pragmatic Goal Achievements
If you are interested in this report and wish to analyze it in more detail, then select the "KPI Satisfaction" option in the main menu to open a screen with an enlarged chart:
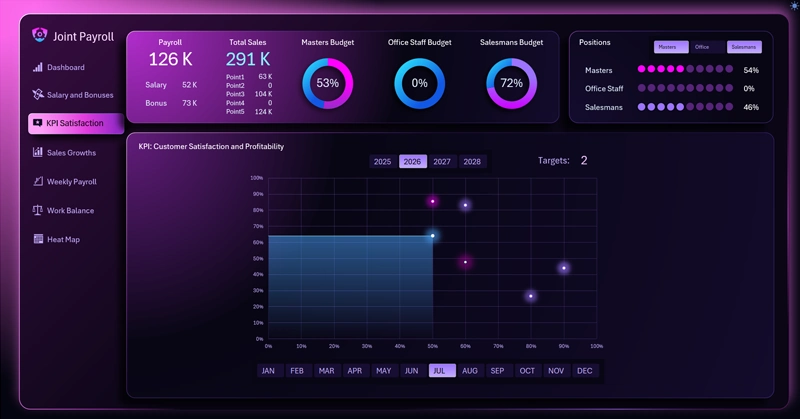
Please note! When switching between different categories in the top right corner, the pragmatic goal achievement map on the chart updates automatically.
Interactive Activity Heatmap with Calendar in Excel

The activity heatmap chart with a calendar is a convenient tool for visualizing and analyzing employee productivity throughout the month. The higher the recorded activity, the brighter the color highlighting the calendar day. When changing the month or year on the dashboard, the calendar and the data on the heatmap update automatically and accordingly. The calendar itself is built using a single formula that fills the cell range on the "Processing" sheet. The formulas for building the heatmap chart are also located there.
Important Feature! The source data for building the heatmap is located on a separate sheet called "heatmap-DATA."
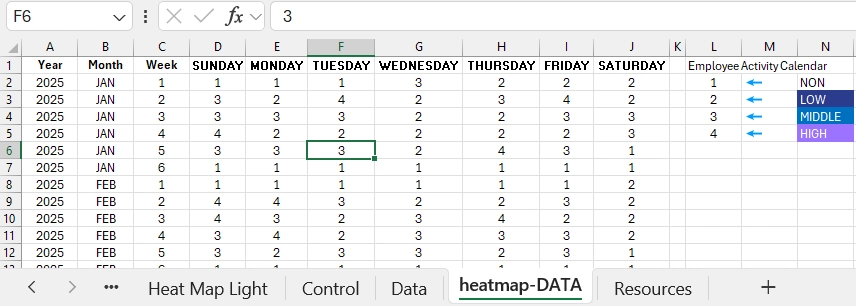
The activity statistics for filling the source data are built using a tracking algorithm. In each table cell on the "heatmap-DATA" sheet, a number from 1-4 is entered. All numbers are filled according to date parameters:
- year;
- month;
- week number in the month;
- day of the week.
Each activity value has the following designation:
- – such a day of the week does not exist relative to the date (transparent color).
- – low activity value (dark indigo color).
- – medium activity value (blue color).
- – maximum high activity value (bright purple color).
Data should be obtained in advance from tracking systems. For example:
- surveillance cameras with video analytics;
- AI systems for idleness detection;
- mobile access;
- DLP messengers;
- access cards;
- time trackers;
- biometrics;
- turnstiles.
Export data from your staff activity tracking systems. Then, specify to an AI the construction algorithm for filling such a table described above. The AI will convert your worker activity data for the sheet titled "heatmap-DATA" with the source values for the heatmap to use in this template.
Activity Heatmap Chart Screen with Interactive Calendar
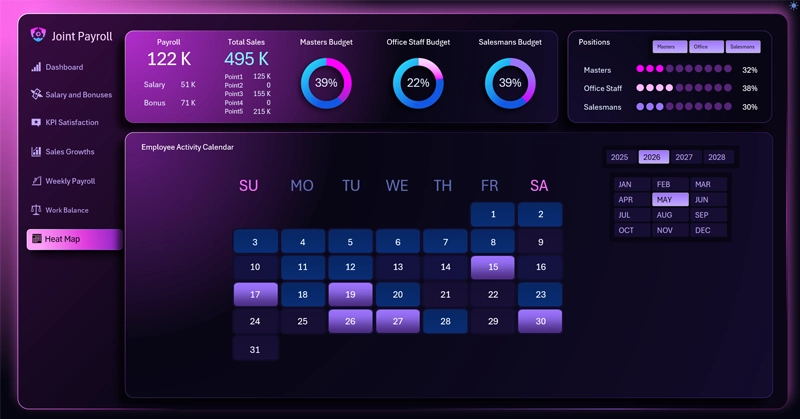
If you need to print this report or present it, use the corresponding dashboard screen from the main menu.
Supporting Visualization Blocks
Additional charts do not require close attention but significantly improve analytical work.
Dashboard Header with Summary Data

A place for a manifesto of summary information regarding the results of investments in the HR system via payroll and the generation of profit via sales. 3 charts allow monitoring the budget expenditures allocated to the 3 main employee categories from the total payroll fund. If budget expenses are segmented into categories, expense control becomes more efficient and informative.
Distribution of the Payroll Fund into Employee Category Shares
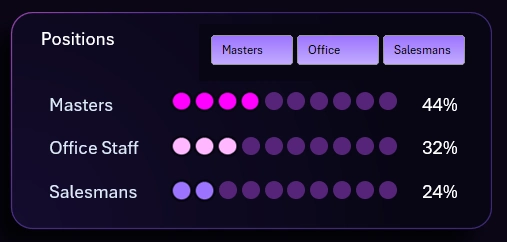
A horizontal histogram showing the split of payroll information on the dashboard by categories is displayed here. For example, if only one employee category is selected, then 100% of the salary shown on the dashboard belongs to that single category.
Interactive buttons in this visualization block have broad authority and extend their influence to managing the entire dashboard. To segment all data on all charts by category, use this button block.
Working Time Balance
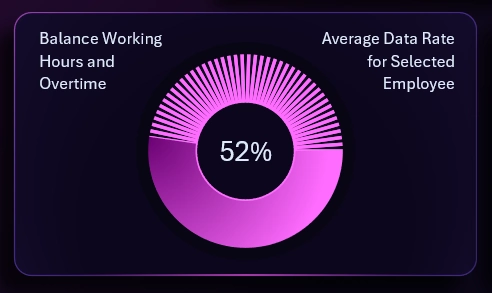
The working time balance chart is displayed in relative percentage values. This is the last chart on the dashboard. It also complements the overall picture and is always vital for every HR visualization.
Dashboard Template Potential for Analytics System Developers
The concept dashboard for effective payroll management in Excel has broad potential for development and refinement as a full-fledged product and useful tool. Every product should always have 2 types of value:
- Practical value.
- Emotional value.
The total potential for practical use is described above. But it is also important to pay attention to the design, which is responsible for the emotional value of the BI product. For example, a user can not only derive aesthetic pleasure from working due to an attractive interface design but also switch to a light UI version:
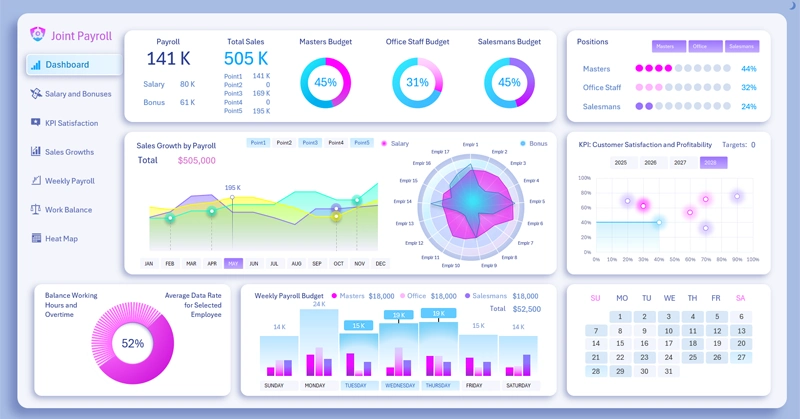
As can be seen, the light design version is no less attractive and also has practical value for comfortable work during daylight hours. Moreover, in the light design version, the button blocks with authority extending over the entire dashboard have a distinct highlight color compared to local buttons. Now they are easily distinguishable visually.
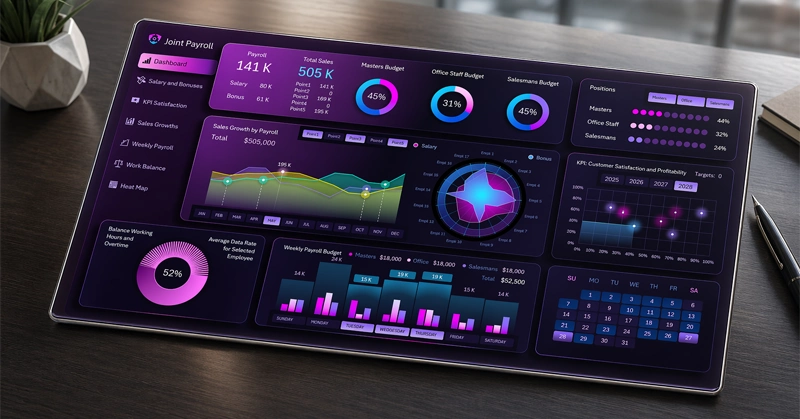
Overall, the template possesses quite strong potential for expanding capabilities and practical use in business analytics:
Download this Payroll Dashboard Example in Excel 
You may freely use this template not only for inspiration in developing your own BI tool products but also for mastering Excel data visualization capabilities. The next dashboard template will be even more attractive and useful for practical business application. All materials are ready—stay tuned for new publications on social media.

Data Visualization Charts for Interactive Report Creation in Excel.
Dashboard Templates