Where and How to Use Gantt Charts in Excel download
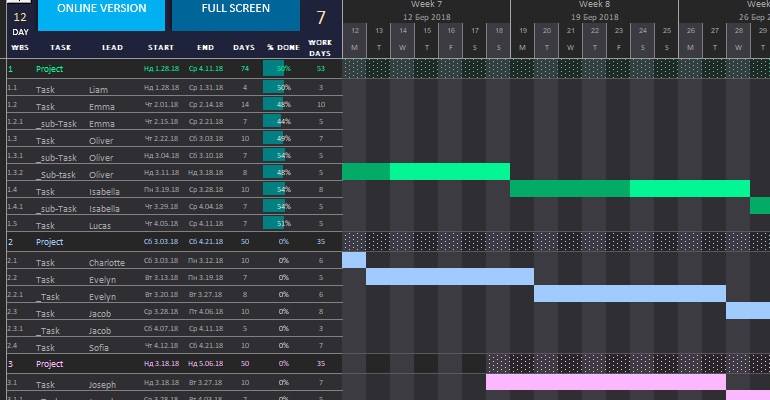
Is it possible to create an appealing Gantt chart in MS Excel without using macros, only by utilizing standard formulas and functions? In this example, one of the solutions to this task is presented. Assess its capabilities by downloading a free pre-made template at the end of the article.
What is a Gantt Chart in MS Excel?
Where to Use Gantt Charts:
Gantt charts are an effective project management tool that presents data visualization in the form of graphs.
Maximizing Project Management Efficiency

Using Gantt Charts in MS Excel

Microsoft Excel is a widely available and versatile tool that can be used to create Gantt charts, making it an excellent choice for those seeking an economical and straightforward way to manage projects. In this article, we will explore how to create and use Gantt charts in MS Excel for effective project management.
Presenting a Gantt Chart in MS Excel – an Example
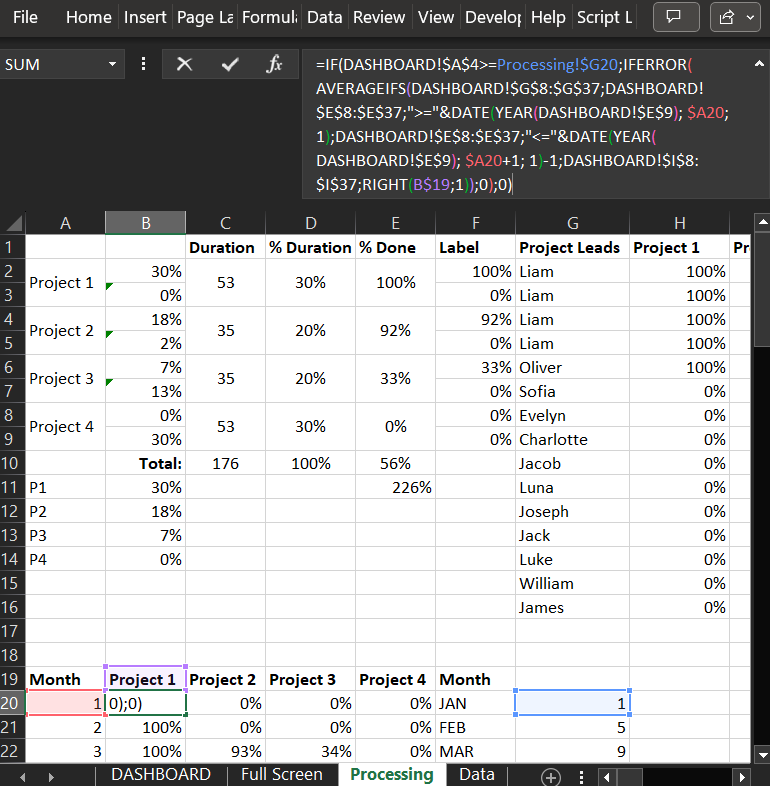
Only functions and formulas provide automation and interactivity to interact with the user in this example.

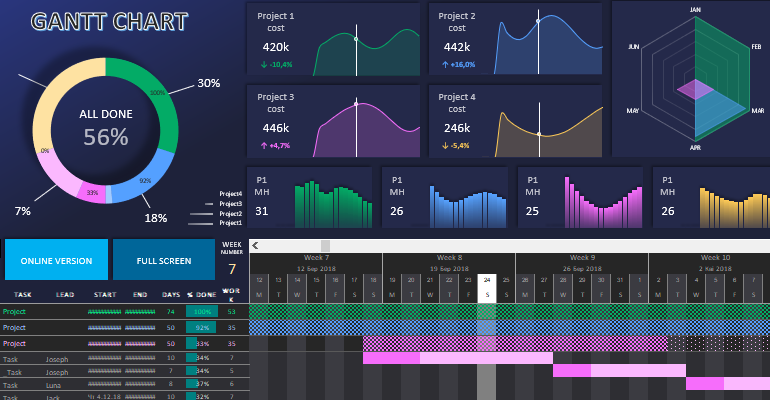
Use our template to evaluate Excel's capabilities in data visualization.
Example of a Gantt Chart Template in MS Excel:

 Download the Gantt Chart Template in Excel for Free
Feel free to use it for the successful implementation of your projects in practice.
Gantt Chart Template OnlineThis short video tutorial demonstrates the capabilities of the template without using macros.
