Examples of Formulas for Calculating Frequency in Excel
Quartiles are a popular tool used to divide data into equal ranges, and Excel provides a dedicated function for this purpose — QUARTILE. However, there are cases when you need to split data into custom ranges. The FREQUENCY function allows you to segment data in Excel into any number of segments based on user-defined conditions.
How to Calculate Frequency in Excel Using a Formula
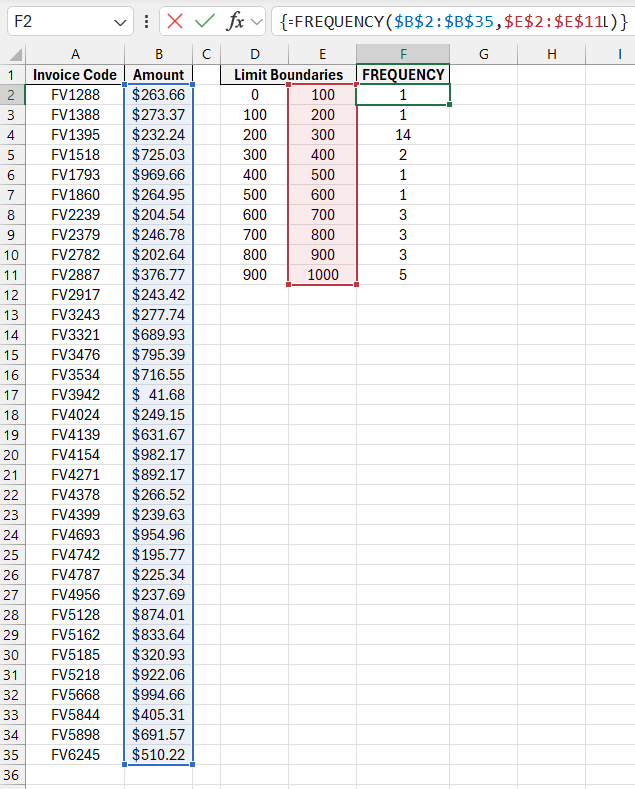
The image below shows a list of invoices with whole-number amounts. Let's assume, for this example, that we need to check how often customers make purchases in the ranges from 1 to 100, from 101 to 200, and so on.
The FREQUENCY function counts all invoices that contain values within a specified range:
The FREQUENCY function is an array function, meaning that when entering it into the formula bar, you must press the combination of keys CTRL+SHIFT+Enter, not just Enter as usual. Excel will then place the formula inside curly brackets ({}), indicating that it is an array formula.
The FREQUENCY function has two arguments:
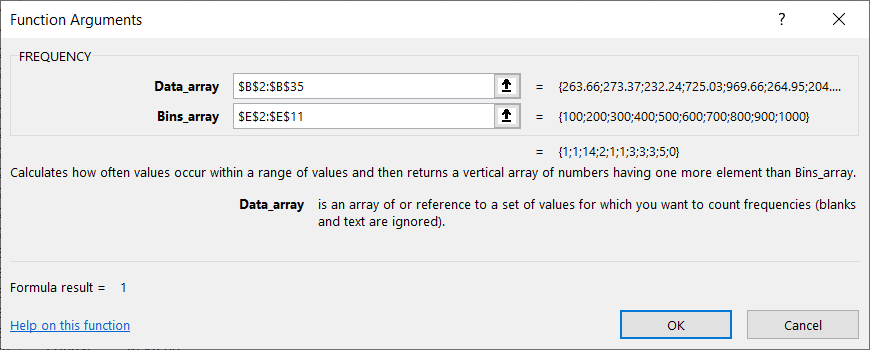
- Data array – the original range of cells to divide into parts.
- Bins array – the range of numbers defining the upper boundaries for those parts.
First, enter the boundaries into column E. The values in column D do not affect the result of the calculation; they are only needed to show the lower boundaries of the data segments visually.
To enter the FREQUENCY function into column F, first select the range F2:F11. Without deselecting, enter the formula. Even though the formula is entered into a single cell, pressing CTRL+SHIFT+Enter will fill the entire selected range with the array formula.
The result returned by the FREQUENCY function shows that most customers make purchases in the range of 200 to 300 during a single visit.
If you try to delete one of the cells in the range containing the FREQUENCY function, Excel will display a message saying, "You cannot change part of an array." Excel treats these and other array functions across a range of cells as a single entity. You can modify the entire range but not individual cells. If you need to change the data segmentation boundaries, you must delete and re-enter the entire array formula.
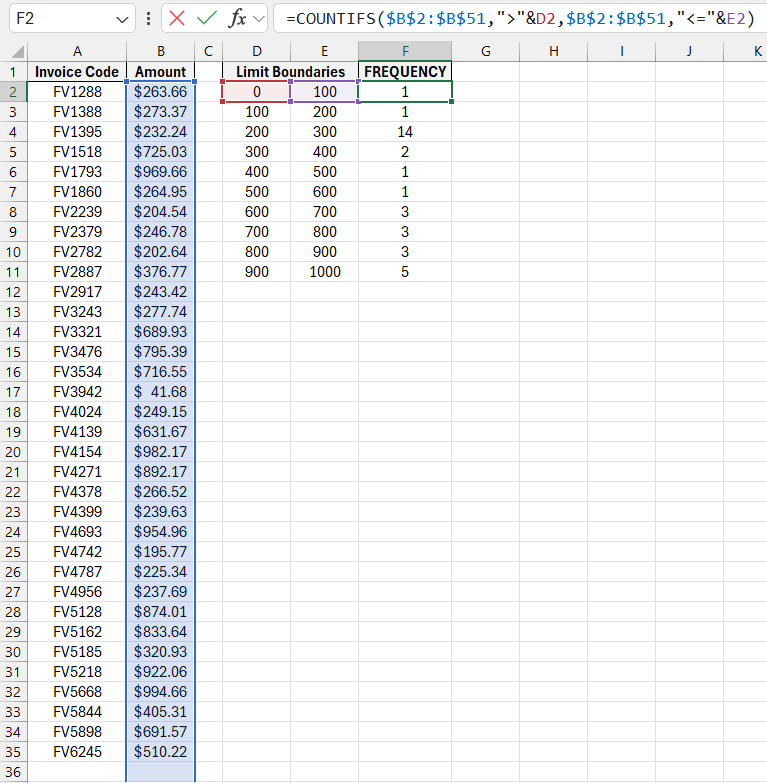
Calculating Frequency in Excel Using the COUNTIFS Function
To create a frequency chart, you can use the COUNTIFS function. This function is not an array function, so making changes to the range boundaries or increasing or decreasing their number is a straightforward task. For the data shown earlier, the COUNTIFS function is used in the following formula:
=COUNTIFS($B$2:$B$51,">"&D2,$B$2:$B$51,"<="&E2)
Download Examples of Formulas for Calculating Frequency in Excel 
Unlike the FREQUENCY function, the COUNTIFS function requires specifying the lower boundary (column D) and counts all values greater than the lower boundary and less than or equal to the upper boundary. This function does not need to be entered as an array formula. You only need to copy it to the subsequent cells as many times as there are defined boundary ranges.

Data Visualization Charts for Interactive Report Creation in Excel.
Dashboard Templates