Examples of Formulas for Calculating Quartiles in Excel
Dividing data into equal parts allows you to understand and visually display what proportion of values belongs to a particular group in relation to all other values. Let’s explore how to segment data evenly in Excel using examples.
How to Calculate a Quartile in Excel
The image below shows a list of employees at a company that produces a specific product, along with statistics on defects found per 1,000 units of finished products inspected by the quality control department. The goal here is to identify the top-performing employees and those who need skill improvement. To do this, we will divide the data into four equal parts. Excel offers the QUARTILE function to determine the boundaries of each quartile. The term "quartile" refers to the boundary value that contains 25% of the data.
The following formula is used in the cell to determine the quartile that covers the highest values:
=QUARTILE($B$2:$B$31,5-ROW(A1))
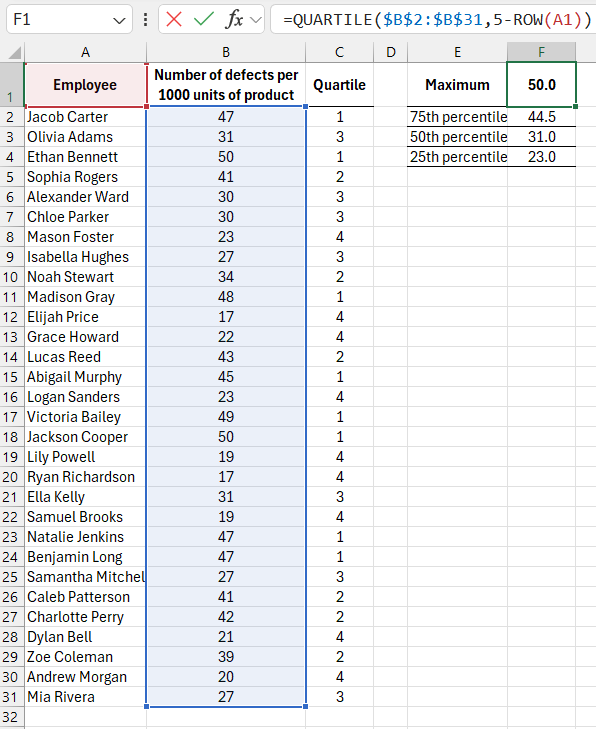
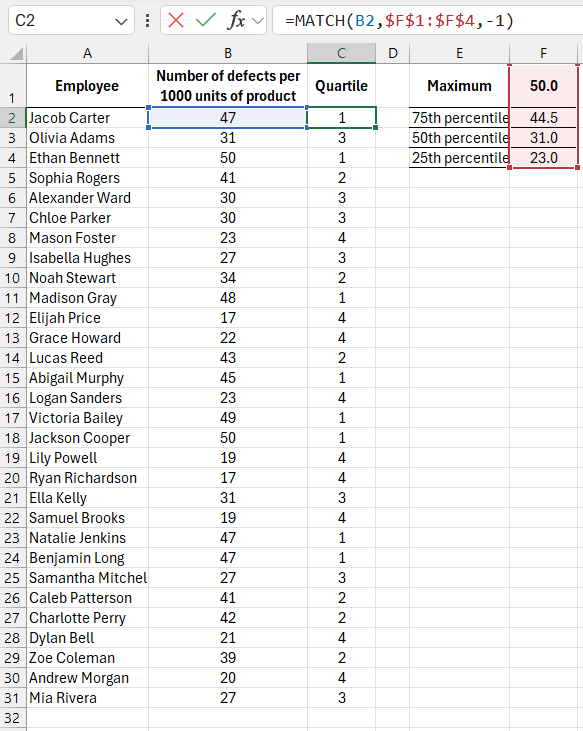
The QUARTILE function calculates the boundary values for the original data. The formula in cell C2 determines the quartile in which the value in cell B2 falls. The formula is copied to the cells below to assign quartiles to all values, and it appears as follows:
The QUARTILE function requires specifying the data range in the first argument and an integer in the second argument, which defines the quartile number for which the boundary value is to be found. Acceptable values for the second argument are:
- 0 – for the quartile containing the minimum value;
- 1 – for the 25% boundary;
- 2 – for the 50% boundary;
- 3 – for the 75% boundary;
- 4 – for the quartile containing the maximum value.
If the quartile number is outside the range of 0 to 4, the formula returns an error. If the quartile number is a fractional value, only the integer part of the argument is used.
In cell F1, the second argument of the QUARTILE function contains a formula: 5-ROW(A1), which decreases the quartile number by 1 as the formula is copied down the column. The expression in cell F1 returns a value of 4, representing the highest quartile. As the formula is copied down, the reference to A1 changes to A2, and the formula returns 5-3, which equals 3 in cell F2, indicating the 75th percentile boundary.
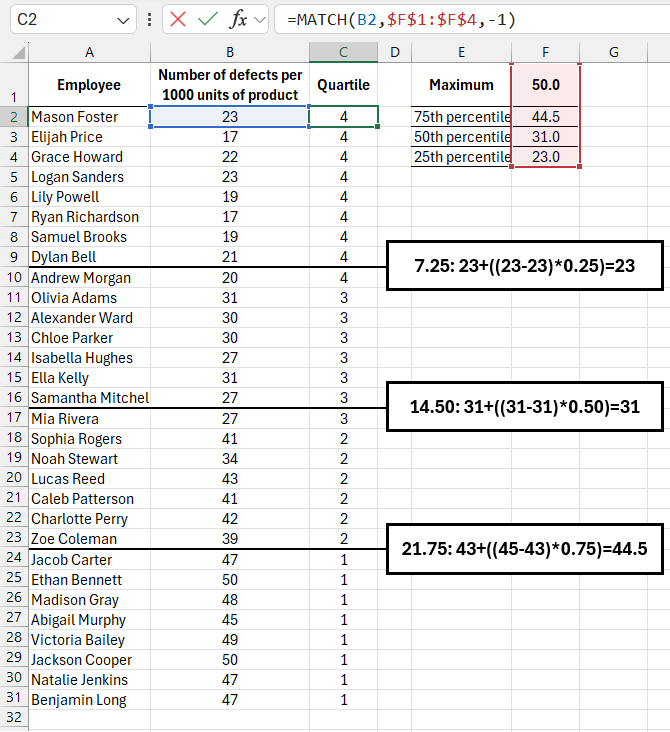
The image below shows how the formula divides sorted data. To verify which quartile a value belongs to, the MATCH function was used. It compares the result range obtained from the QUARTILE function. Since the results are sorted in descending order, the last argument of the MATCH function is set to -1, which specifies a "greater than" comparison:
=QUARTILE.EXC($B$2:$B$31,5-ROW(A2))
The MATCH Function returns the position number where the value was found in the list. It stops calculating when it encounters a value smaller than the lookup value. For example, if the lookup value is 47, MATCH would recognize that 44.5 is smaller and stop at the first position.
Alternative QUARTILE.EXC Function in Excel
The best way to calculate quartile boundaries remains a topic of debate. In older versions of Excel, only the QUARTILE function was available, which calculates based on the formula n%*(count-1). Starting with Excel 2010, new functions offer alternative calculation methods. The QUARTILE.INC function works similarly to the original QUARTILE function, using the same algorithm. The older function remains available to support older file formats. The QUARTILE.EXC function, however, uses a different formula: n%*(count+1).
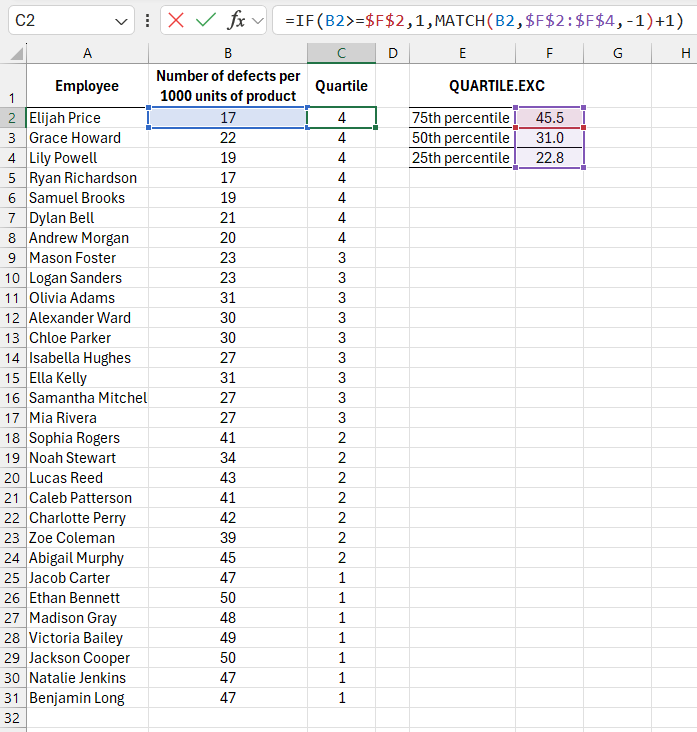
Below is an image showing data processed with the QUARTILE.EXC function:
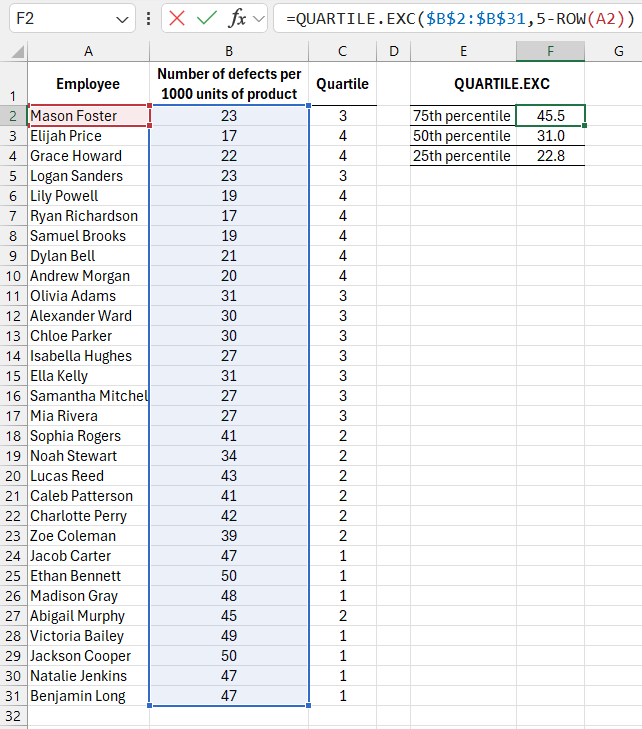
The formula determining the quartile number for each value has also been updated:
=IF(B2>=$F$2,1,MATCH(B2,$F$2:$F$4,-1)+1)
Download examples of formulas for calculating quartiles in Excel 
Since the QUARTILE.EXC function does not calculate boundaries between quartiles for the maximum and minimum values, an IF function was used to check whether the current value exceeds the 75th percentile boundary, which corresponds to the 3rd quartile.
How the QUARTILE Function Works in Excel
The QUARTILE function calculates two values on either side of the quartile boundaries by finding the percentage of the total number of values, reduced by one. It then interpolates between the found values to return the final result.
In one of the above examples, the QUARTILE function performs the operation 0.75*(30-1). For a total of 30 values, the result is 21.75. The function then sorts the values from smallest to largest and counts 21 rows from the smallest value. Since the result is not a whole number, the function interpolates between the two values found. In this example, after counting 21 rows, the numbers 43 and 45 were found. The function uses the fractional value 21.75 to interpolate between 43 and 45, calculating the 75th percentile as 43 + ((45-43)*0.75).
Similarly, for the 50th percentile, the function follows the formula 0.5*(30-1), which returns 14.5. Counting rows from the smallest value, the boundary falls between Aleksandr Blashchik / 31 and Lena Nikolaevna / 31. Since both values are equal, the interpolation is simple, and the function returns 31. The second image shows the same employee and defect data, but it is sorted, with lines indicating the boundaries between quartiles.

Data Visualization Charts for Interactive Report Creation in Excel.
Dashboard Templates