FORECAST Function in Excel and Formula for Predictions
You can use the FORECAST function in Excel to make simple predictions. It helps calculate future values of a given indicator according to a linear trend. Using the least squares method, the function approximates a straight line through ranges of known y-values and known x-values. It predicts y-values corresponding to this line for new x-values. However, it is not possible to obtain a mathematical description or statistical characteristic of the trend model using FORECAST.
Syntax of the FORECAST Function
The function arguments are described as follows:
- Known y-values range. Required argument. An array of known y-values for the equation y = ax + b.
- Known x-values range. Required argument, including an array of known x-values for the relationship y = ax + b.
- New x-values. Required argument. The range of x-values for which you need to calculate y-values.
- Constant. An optional logical value. If the trend calculation should exclude the coefficient b (to follow the relationship y = ax), set it to 0.
Features of the FORECAST function:
- If the known y-values range is in a single column (or row), each column (or row) with known x-values is treated as a separate variable.
- The array of known x-values may include several variables. However, if only one is used, the known x-values and y-values ranges must be proportional. When using multiple variables, the known y-values range must fit into a single row or column.
- If the range of known x-values is omitted, the function assumes an array of 1; 2; 3; 4;... proportional to the known y-values range.
- The range of new x-values must have the same number of rows or columns as the range of known y-values. In other words, they must be proportional to the independent variables.
- If the new x-values argument is omitted, the function assumes it to be equal to the known x-values argument. If known values are also not specified, it assumes an array of 1; 2; 3; 4;..., proportional to the given y-values range.
- To have the function return an array, the formula must be entered as an array formula.
Here are examples of the FORECAST function.
Sales Forecast with Growth and Seasonality
The FORECAST function is useful for time series where data increases or decreases at a constant rate.
A time series of monthly turnover with two variables:
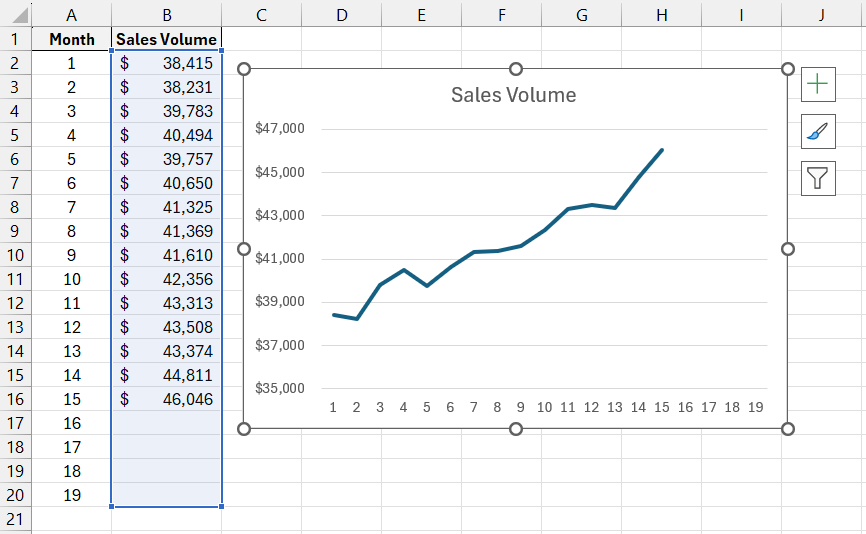
First, calculate linear trend values using an Excel chart. On the X-axis are month numbers, and on the Y-axis are turnover values.
Add a trendline and its equation to the chart.
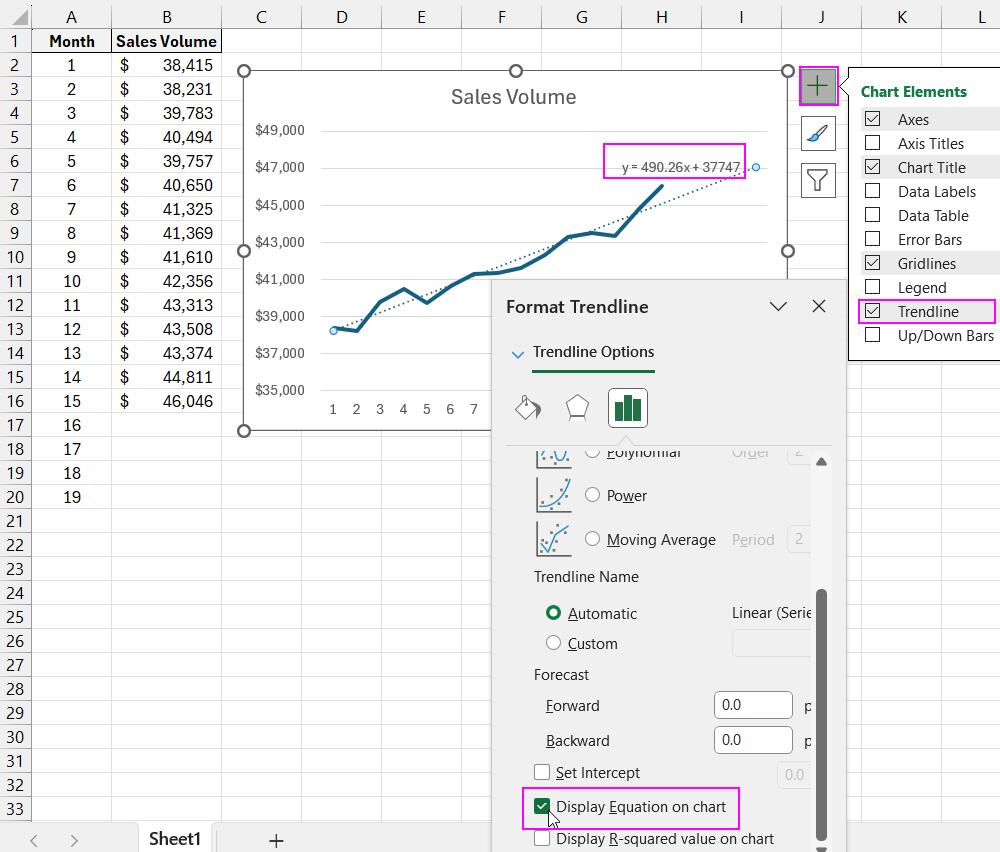
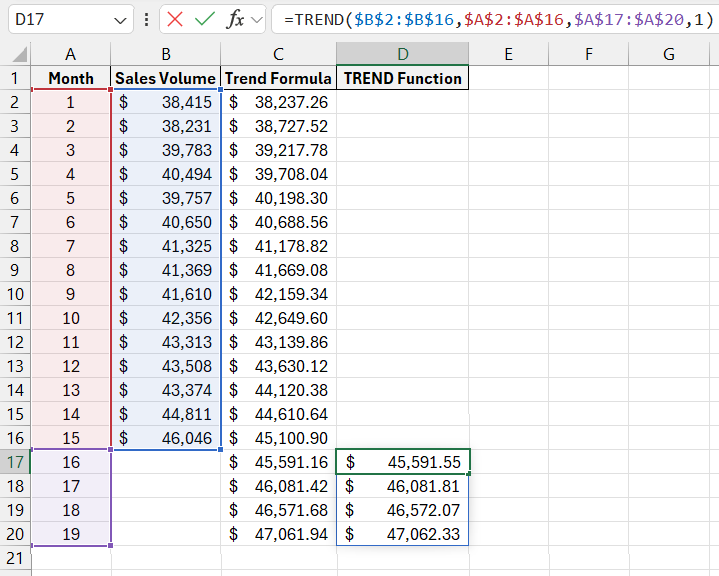
To forecast future sales, calculate linear trend values for the analyzed data and future periods using the trend equation y = 490.26x + 37747.
Linear trend values are calculated for each month.
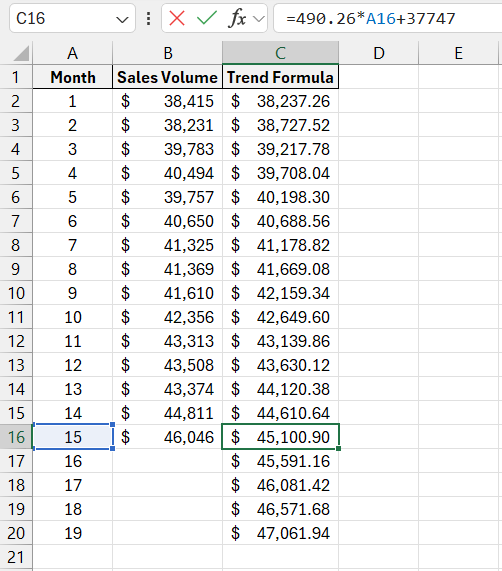
The trend values for future periods (16–19) are obtained. For instance, in month 16, the forecasted sales value is 45591.16 thousand rubles.
Next, forecast the turnover using the built-in FORECAST function. Open the “Function Wizard.” In the “Statistical” category, locate the required function. Fill in the arguments:
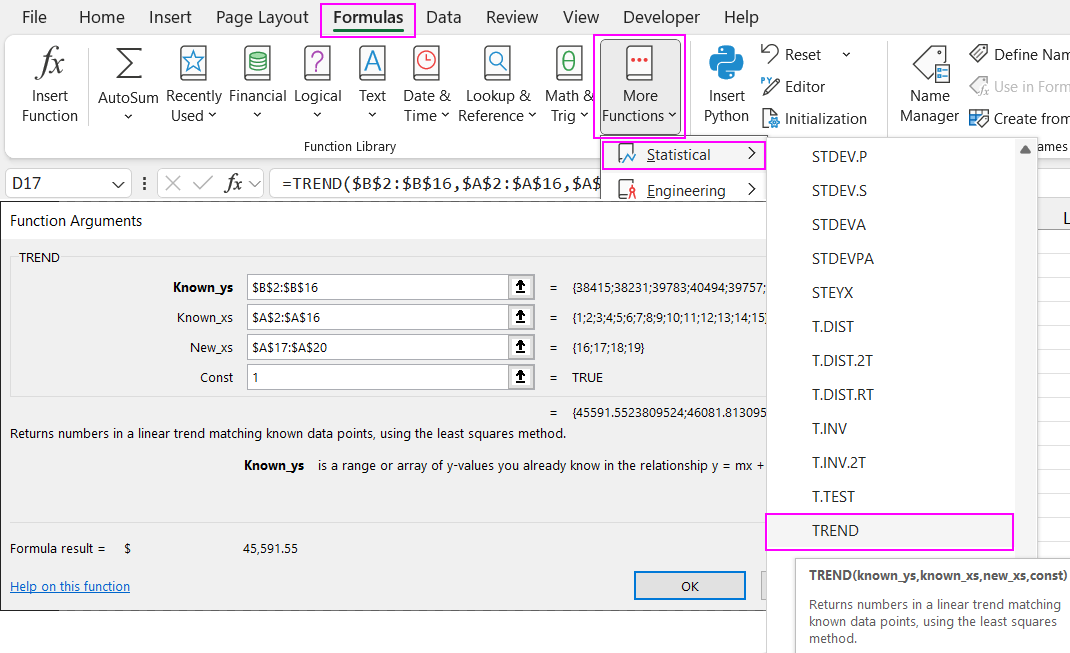
Known y-values – the range with sales volumes. These values must be fixed (F4 key) to keep the array constant when copying the formula.
Known x-values – month numbers for which the function calculates linear trend data. These values must also be fixed.
New x-values – month numbers for which sales need to be forecasted.
Set the “Constant” argument to 1. The function will include the coefficient a in trend value calculations.
Note: The known value ranges are proportional.
Download FORECAST Function for Predictions in Excel 
The FORECAST function provides the same forecasted values for periods 16–19.

Data Visualization Charts for Interactive Report Creation in Excel.
Dashboard Templates