Formula for Comparing Two Tables by Condition in Excel
Often, Excel users need to compare two tables and identify only those entries present in the first table but missing in the second. Conditional formatting is an ideal tool for displaying comparison results for such tasks.
How to Compare Data in Two Different Tables in Excel
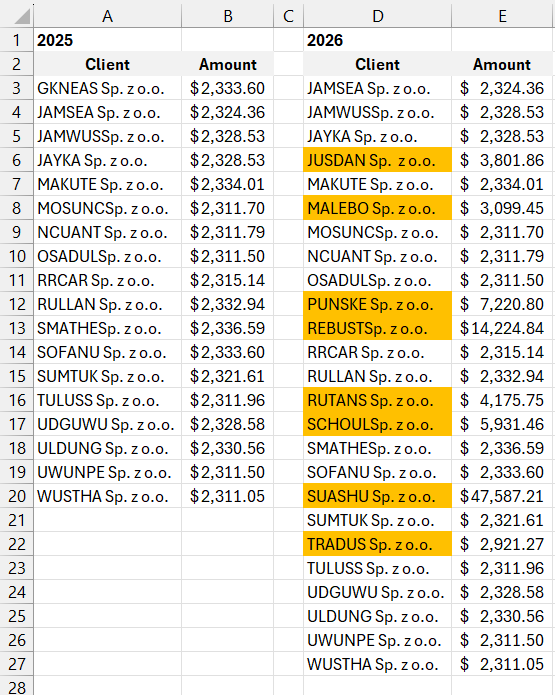
Below is an example where customer names are compared for the years 2025-2026. The new customers who appeared in 2026 (i.e., names not found in 2025) are highlighted in color.

To create the formatting rule described above, follow these steps:
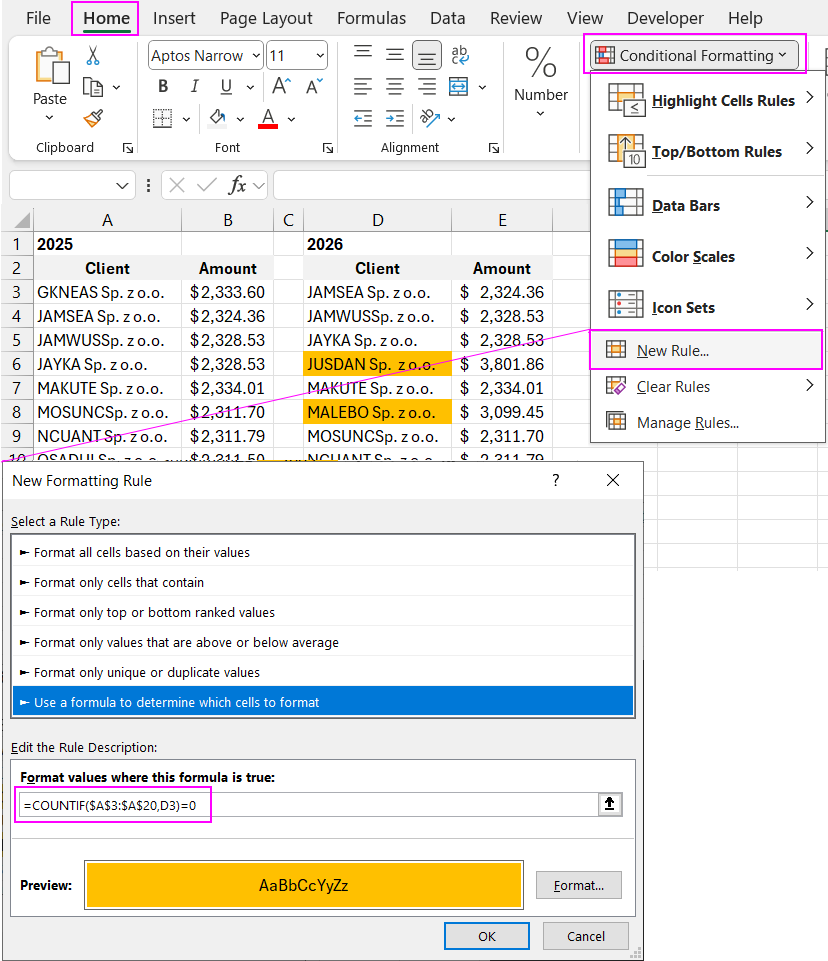
- Select the target range of cells (in this example, $D$3:$D$27) and choose: "HOME" - "Conditional Formatting" - "Create Rule." The "New Formatting Rule" dialog box will appear, as shown below:
- From the list at the top of the window, select the option "Use a formula to determine which cells to format." This option allows us to use a formula that will evaluate each cell in the selected range based on a specific condition. If the value meets the logical condition of the formula and returns TRUE, the specified formatting will be applied to that cell.
- In the formula input field, enter the logical expression shown at this step. The formula uses the COUNTIF function to check if the value in the target cell D3 exists in the analyzed range $A$3:$A$20. If the value is not found, the function will return 0, triggering the conditional formatting for the current cell. Similar to standard formulas, ensure the source range is an absolute reference, while the target cell should be a relative reference. This allows each cell in the selected range to be compared with the corresponding reference cell.
=COUNTIF($A$3:$A$20;D3)=0
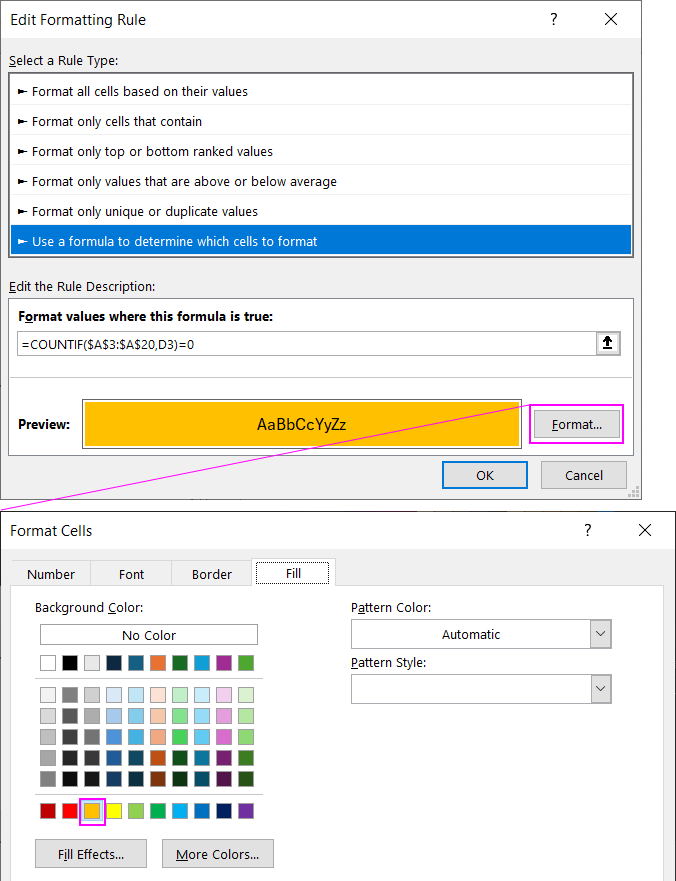
- Click the "Format" button, and the "Format Cells" window will appear, where you can choose formatting options for fonts, borders, and fills. After specifying the necessary formatting, confirm by clicking "OK" in all open windows.


Download formula example for comparing two different tables by condition in Excel 
As a result of comparing the two tables, only the unique values—those that do not match—will be highlighted. In this case, these are the new customers who were not present in 2025.
