How to Calculate Break-Even Point BEP Using Excel Formulas
In business, it is often necessary to determine the amount of revenue required to achieve a net profit of zero in order to break even—this is known as the Break-Even Point (BEP). The revenue at which this occurs is also referred to as the profitability threshold. To calculate it, you need to assess fixed costs and the percentage of variable costs. Using this data, you can calculate the revenue that establishes the BEP.
How to Calculate the Break-Even Point for a Company in Excel
The image below shows an example of calculating the Break-Even Point. In column B, some cells contain the letter "P," which stands for "Fixed Costs." Other cells contain a percentage that indicates the portion of costs relative to revenue. For example, analysis and development costs will be incurred according to the budget and will not change if revenue increases or decreases. However, if bonuses are paid, sales expenses will increase or decrease depending on the revenue level.
Source data table:
| Income Statement | ||
| Revenue | $16,935.00 | |
| Cost of Goods Sold | 40% | $6,774.00 |
| Gross Profit | $10,160.80 | |
| Selling Cost | 8% | $1,354.80 |
| Net Profit after Variable Costs | $8,806.00 | |
| Research and Development | F | $2,046.00 |
| General and Administrative Expenses | F | $4,927.00 |
| Operating Profit | $1,833.00 | |
| Interest Expenses | F | $465.00 |
| Other Costs and Expenses | F | $1,368.00 |
| Net Profit | $0 | |
*F - Fixed Costs
The figures used to calculate the break-even threshold (numbers next to the blank cells in column B) are calculated as follows:
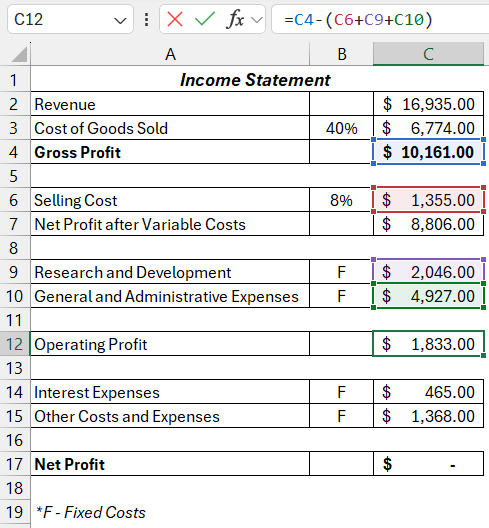
- Formula for calculating operating profit.
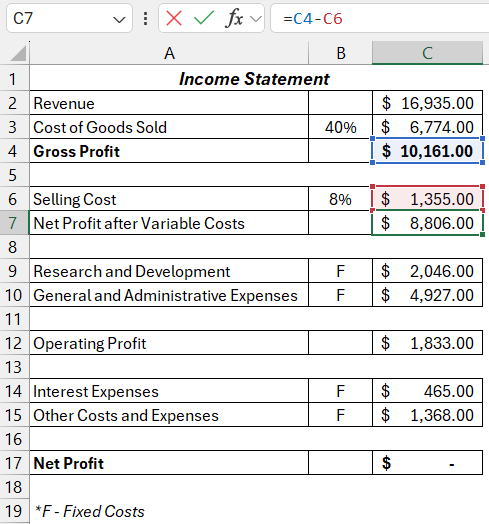
- Formula for calculating net profit after deducting variable costs.
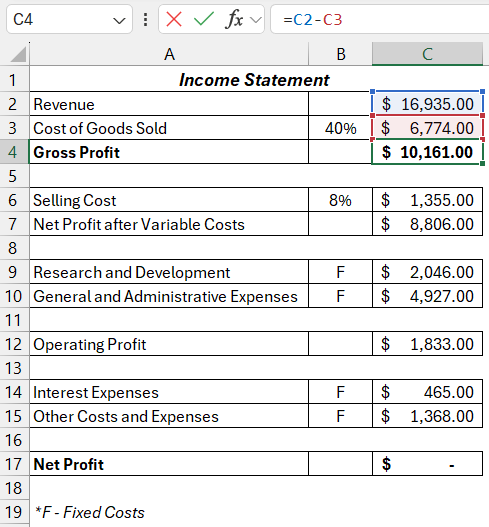
- Calculation of gross profit.
Two types of variable costs shown in the image:
- Cost of Goods Sold (COGS).
- Sales costs.
As a result, we obtain a table for calculating the break-even point:
Download the formula example for calculating the Break-Even Point (BEP) in Excel 
They are calculated by multiplying the revenue amount by the percentage value of the costs.
Indicators for Calculating the Break-Even Point (BEP) in Excel
To create a data model for calculating the profitability threshold shown in the image, follow these steps:
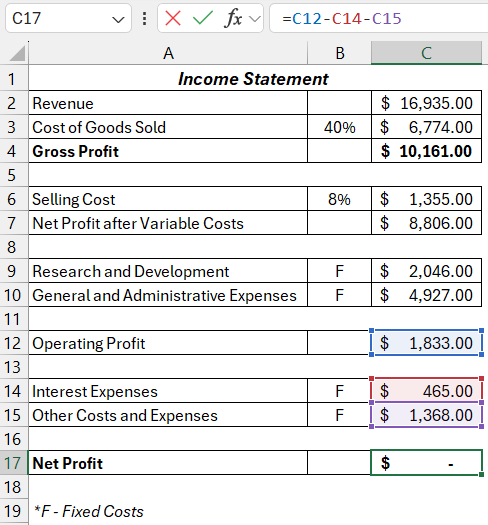
- In cell C17 containing the value "Net Profit," enter 0.
- In column C, enter the corresponding values for fixed costs in the cells described in column B.
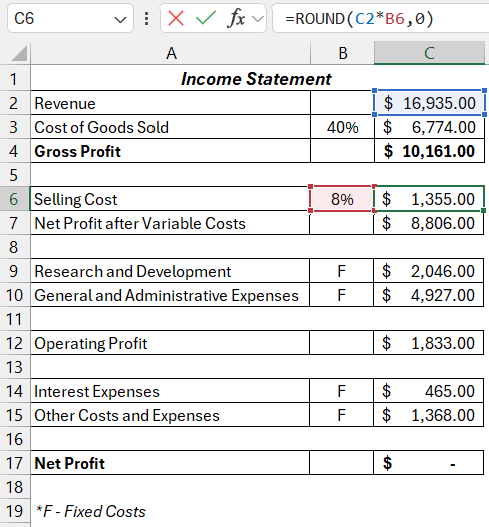
- In cell B6, enter the bonus percentage paid by the company (in this example, 8%).
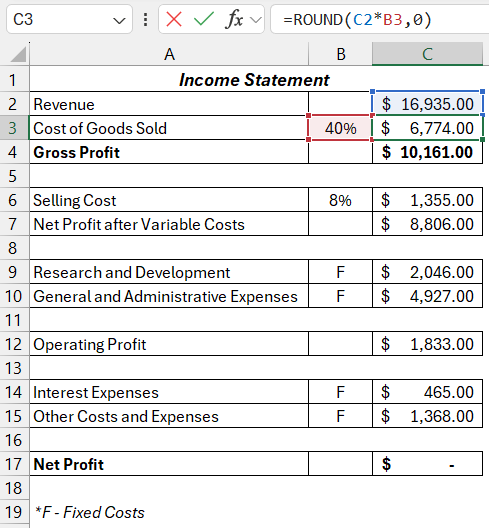
- In cell B3, enter the percentage calculated by subtracting the expected gross profit percentage from one. In this example, the company expects a gross profit of 60%. Therefore, cell B3 contains the result of the formula 40%: =1-C4/C2. Avoid entering this formula into cell B3 directly to prevent circular references in other formulas; just enter the result.
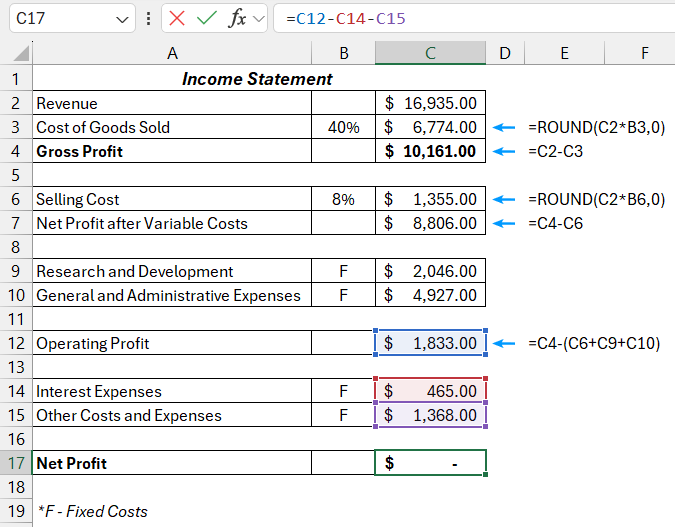
- In cell C12, enter the formula for calculating operating profit. Operating profit should equal the sum of "Interest Expenses" and "Other Costs and Expenses." As shown in the image, if the estimated interest expenses are 465 and other costs and expenses are 1368, the operating profit must be 1833 for the net profit to be 0.
- In cell C7, enter the formula for calculating net profit after deducting variable costs. This is the sum of operating profit and fixed operating expenses. This value will be used to calculate revenue.
- In cell C6, enter the formula for calculating sales costs. Until the formula for calculating revenue is entered, the result of this formula will be zero. After entering the revenue calculation formula, the correct value will appear.
- In cell C3, enter the formula for calculating the cost of goods sold (COGS). Similar to the formula for calculating sales costs, the formula will return a value of 0 until profit is calculated.
- Finally, in cell C2, enter the formula for calculating revenue. Revenue is calculated by dividing the "Net Profit after Variable Costs" by the result of subtracting the sum of the variable cost percentages from one. In this example, variable costs make up 48% of the revenue (40% + 8%). The value in cell C7 should be divided by the result of subtracting 48% from 100%, which will calculate the revenue:
= C7/(1-SUM(B3:B6))
As a result of the calculations, the Break-Even Point is $16,935.
If the company expects a gross profit of 60%, pays bonuses of 8% of revenue, and has estimated fixed costs, it will need to generate revenue of $16,935 to break even.

Data Visualization Charts for Interactive Report Creation in Excel.
Dashboard Templates