How to get Current Value of Investments Using NPV in Excel
The PV (Present Value) function is used to calculate the current value of money in Excel, provided that all payments (dividend payments or loan repayments) are equal amounts. However, in practice, payment amounts are often different. To solve this problem, Excel offers the NPV (Net Present Value) function, which allows calculating the net present value of investments with varying regular payment amounts.
Example of Investment Plan Analysis Using the NPV Function in Excel
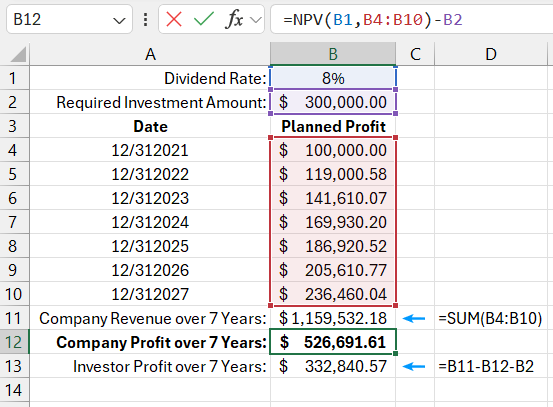
Suppose a young company is looking for an investor to invest $300,000. According to the agreement, the company commits to paying dividends annually to the investor over seven years. The projected profitability of the company for each year, given this investment amount, is shown in the chart below. The projected return on investment for the investor is 8% per year.
=NPV(B1,B4:B10)-B2

To analyze the viability of attracting investments at 8% per year into this company, the NPV function is used to calculate the net present value of the invested funds.
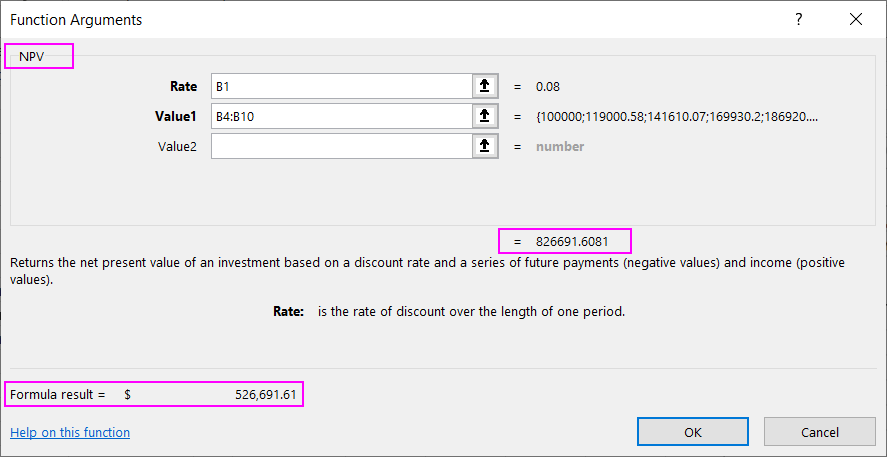
The NPV function discounts each dividend payment at a specified interest rate, similar to the PV function, but with a few differences. The NPV function uses a range of future payment amounts instead of a single payment amount. A key distinction is that the NPV function does not include a "Number of periods" argument, as the number of values in the range defines the number of future payments:

Although the payment amounts can vary, they must be made regularly (in this example, annually). Additionally, as with other Excel financial functions that calculate the time value of money, the interest rate must correspond to the payment periods (annual, monthly, or daily interest rates). In this example, the annual interest rate is set at 8%, and the payments are made annually, meaning the input data is consistent. If dividends were paid quarterly, a quarterly interest rate would need to be used (8%/4 – dividing the 8% annual rate by 4 quarters gives a 2% quarterly rate).
The NPV function returns a value of $826,691.60 for the specified revenues, already accounting for dividends but not the initial investment, which must be returned to the investor at the end of the 7-year period. Therefore, $300,000 must be subtracted from the result (i.e., 826,691.60 - B2). Since the calculated value of $632,840.57 is greater than the initial investment of $300,000, it indicates that the investor should invest to earn a final profit of $332,840.57 over 7 years. For the company's owners, the deal is also profitable, as they earned $526,691.61 over 7 years, covering all dividend expenses and returning the principal investment to the investor. As in modern business, both parties benefit.
In the previous example, the investor needed to make a large initial investment to profit in the future. The NPV function can also be used in other situations. For instance, the investor might make smaller investment installments at the beginning, with returns coming in later years.
Analysis of Present Value with Different Contribution and Payment Amounts
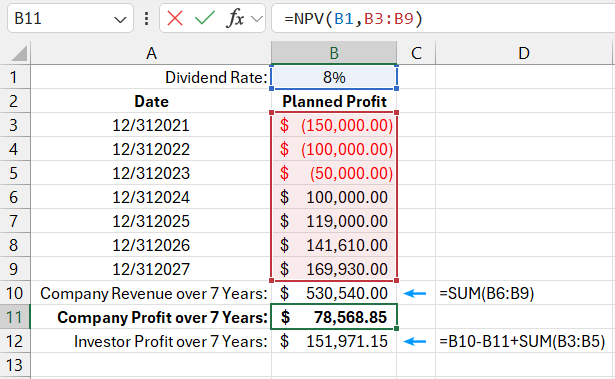
Suppose, instead of a one-time investment of $300,000, the investor can only contribute $150,000 in the first year, $100,000 in the second, and $50,000 in the third. The investment amounts decrease as the company develops since it can increasingly refinance using its own funds. By the fourth year, no further investments are necessary as the company is expected to be profitable enough to start paying dividends.
The chart below shows the investment contributions over 3 years and the dividend payments over the remaining 4 years. The same NPV function is used as in the previous example, but with different input values, and no subtraction is needed in the formula, as negative numbers are already used:
=NPV(B1,B3:B9)

Download Example of How to Calculate Current Value of Investments in Excel 
In the first example, the invested amount was not included in the NPV function calculations. The final result was simply compared with the required investment amount. In this example, the investment amount is split into parts, all expressed as negative numbers (expenses), while the company's profits are expressed as positive numbers (income).
In this case, there is no need to compare the result with the investment amount, as the NPV function gives the final result. If the final result is greater than 0, it means the company's profits exceed the 8% annual return. If the result is less than 0, the company's profitability was below 8% (insufficient to meet investor obligations). As shown in the chart, this investment plan is attractive to investors but significantly less so for the company's owners.
