How to Use FORECAST Function for sales analyse in Excel
Data interpretation and creating forecasts based on it are integral tasks for economists. For forecasting purposes, one of Excel's statistical functions — the FORECAST function — can be used. It calculates a future value based on given data. Excel uses linear regression. The FORECAST function is applied for predicting product demand trends, equipment needs, future sales, and more.
Syntax of the FORECAST Function
Arguments:
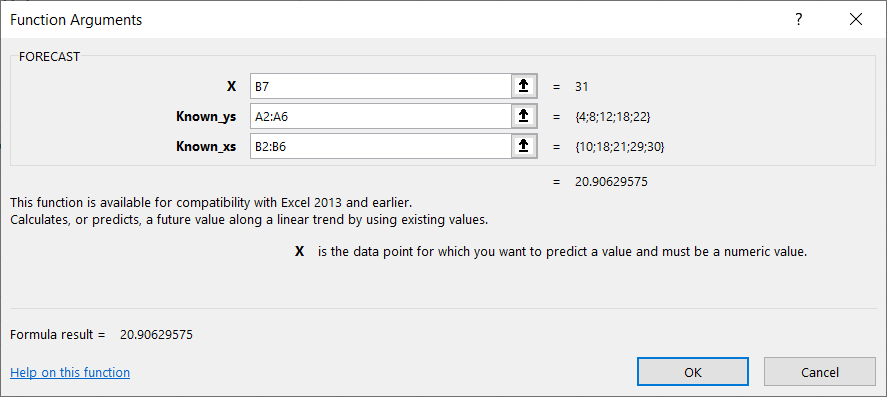
- x Value: A specific numeric argument for which you need to predict the y value.
- Known y-values: Known numerical data used for calculation.
- Known x-values: Known numerical data used for calculation.
Excel returns an error when:
- The x argument is not a number (results in a #VALUE! error).
- The x and y data arrays are empty (#N/A error).
- The number of x-values doesn’t match the number of y-values (#N/A error).
- The variance of the x-values equals zero (results in a #DIV/0! error).
The equation used for the function is a + bx, where:
- a = intercept
- b = slope
Here, x and y are the averages of the respective data ranges (x-points and y-points).
Example of the FORECAST Function in Excel
Let’s start with some sample numbers for x and y values:
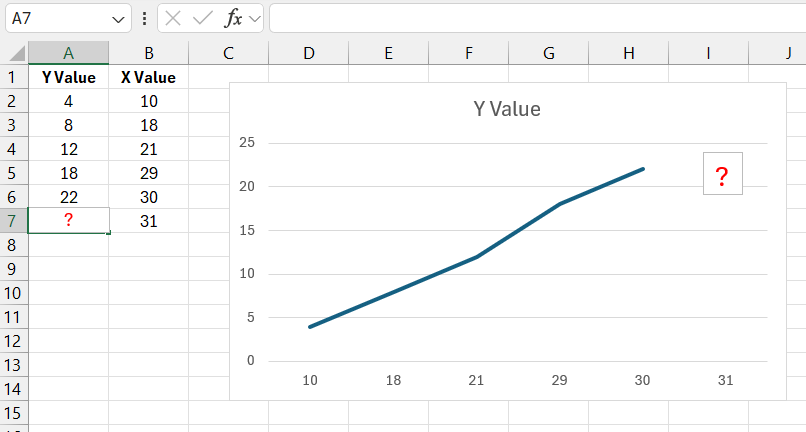
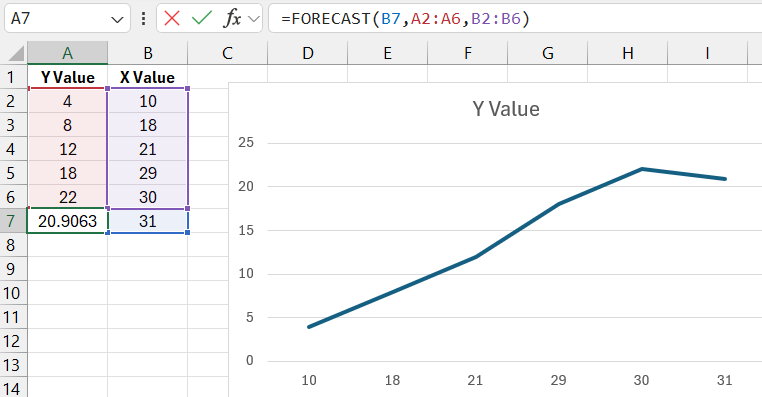
In a blank cell, enter the formula: =FORECAST(31,A2:A6,B2:B6). The function calculates the y-value for a given x = 31. The result is 20.9063.
We’ll use this function to forecast future sales in Excel.
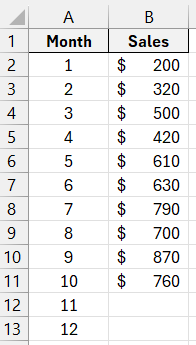
First, create a chart based on the available data:
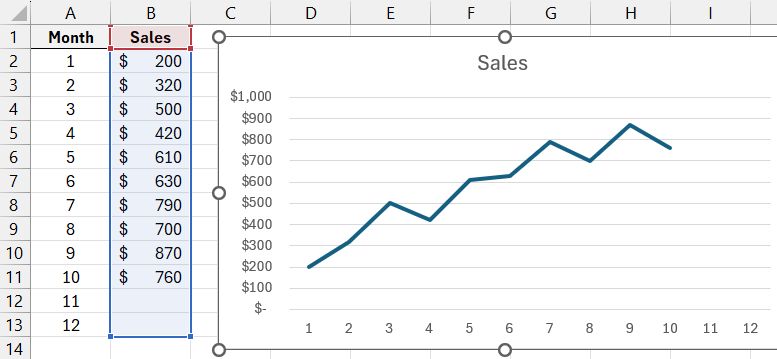
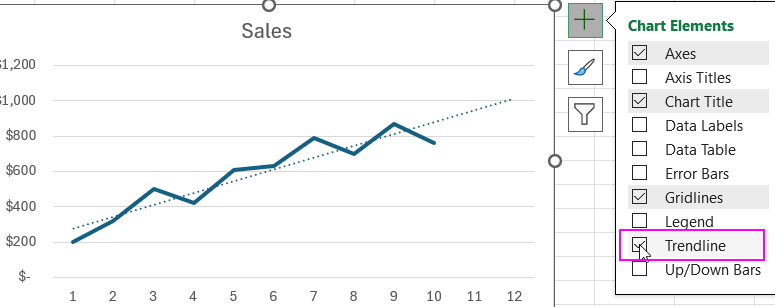
Select the chart. Right-click and choose "Add Trendline." In the settings window, check the boxes for "Display Equation on chart" and "Display R-squared value on chart."
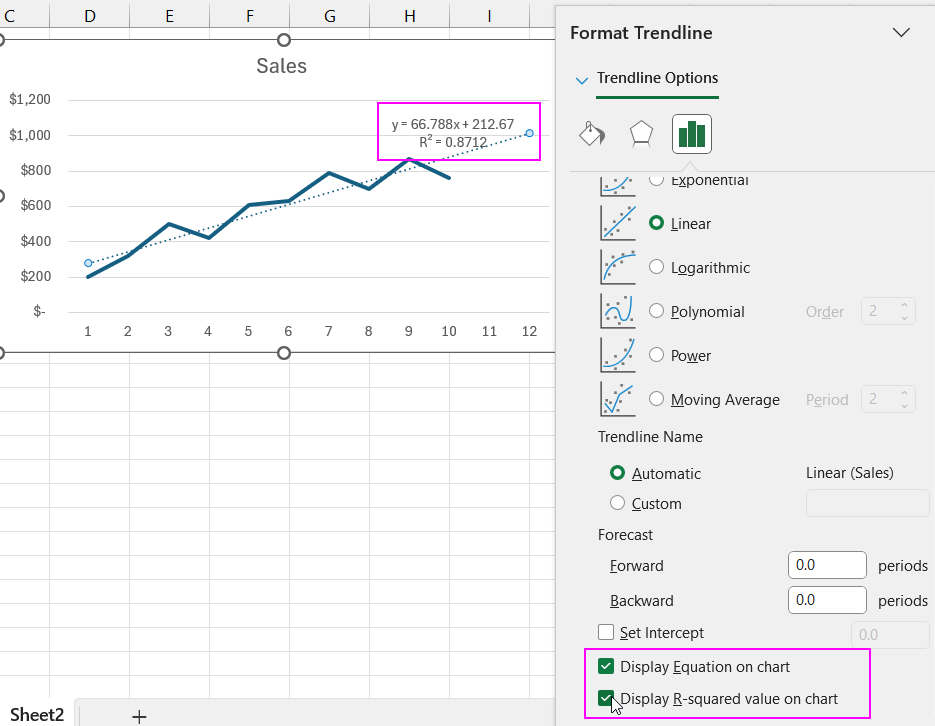
The trendline is designed to show data trends. We extended the trendline slightly to forecast values beyond the actual data range, predicting future values. The chart displays a clear upward trend in future sales for the next two months.
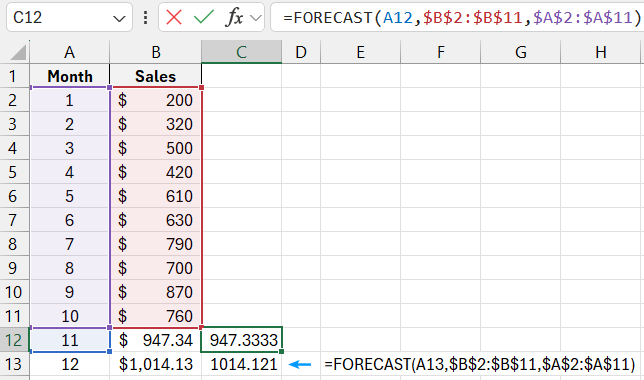
To calculate future sales, we can use the equation that appears on the chart after adding the trendline. This equation can also verify the results produced by the FORECAST function.
Substitute the x-value (11th month) into the equation to get the y-value (sales for the desired month). Copy the formula down the second column.
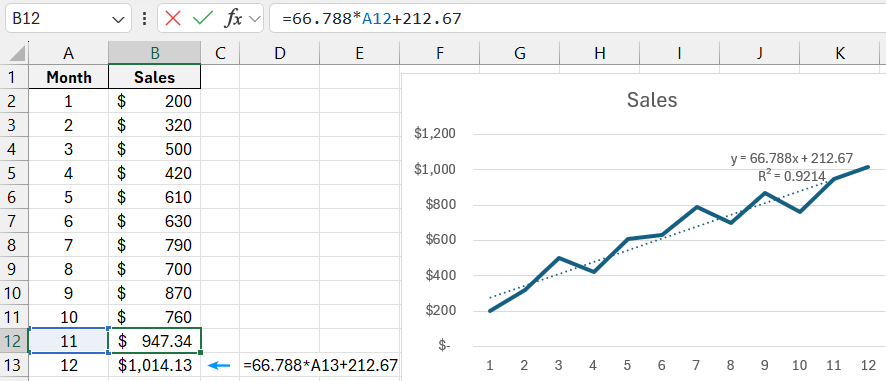
Now, use the FORECAST function to calculate future sales. The x-point, for which you need to calculate y, corresponds to the month number for forecasting (in our example, cell reference A12 with a value of 11). The formula is: =FORECAST(A12,$B$2:$B$11,$A$2:$A$11).
Download an example of using the FORECAST formula in Excel 
Absolute references for the y and x value ranges make them static (preventing changes when dragging the formula downward).
Thus, the FORECAST function in Excel can be used to predict future values based on existing data. It is part of the statistical function group and allows you to easily generate y-value predictions for specified x-values.
