INTERCEPT Function in Excel for Phenomenon Forecasting
The INTERCEPT function in Excel finds the point where a linear graph intersects the Y-axis, based on given x and y values. This intercept is determined on the optimal regression line whose coefficients are the "known x-values" and "known y-values." This function is often used to find the value of the dependent variable when the independent variable equals zero.
Features and Syntax of the INTERCEPT Function
Description of arguments and parameters:
- Known y-values. An array of dependent variables, data, or observed results.
- Known x-values. An array of independent variables, data, or observed results.
Both arguments are required. They can be expressed as numbers, names, arrays, or references.
Features of the INTERCEPT function:
- The function ignores empty cells and cells containing text or logical values. However, it does account for zero values.
- If the arguments contain a different number of values or lack data entirely, the #N/A error is returned.
- The intercept of the linear regression graph on the Y-axis has an equation where x and y are calculated using the AVERAGE function (mean values of x and y datasets).
Examples of the INTERCEPT Function in Excel
When modeling economic, physical, technical, or social processes in Excel, various methods are used to estimate function values based on known data at specific fixed points.
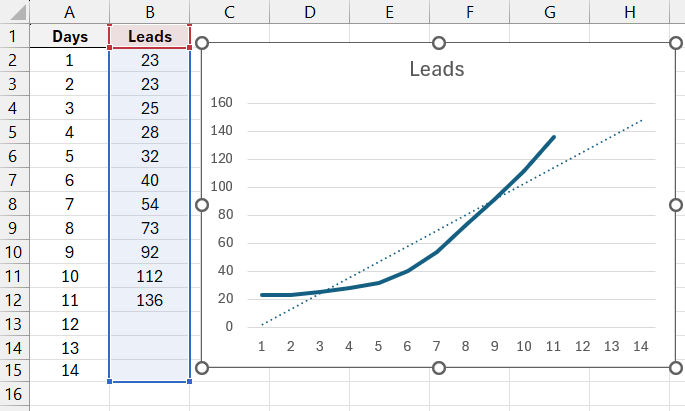
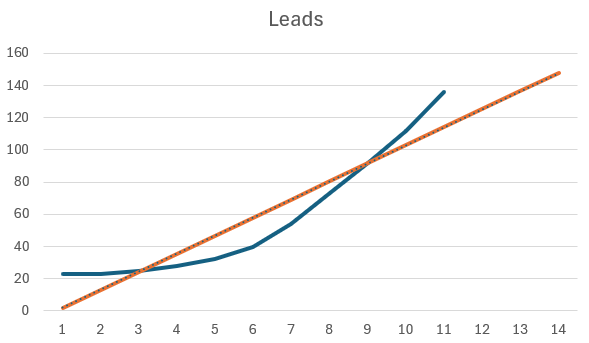
Some statistical functions in Excel allow you to generate regressions (trendlines) directly from tabular data without building a chart. The simplest modeling approach is linear regression, which works well when variable values grow or decrease at a constant rate.
To construct linear regression in Excel, you can use the statistical INTERCEPT function. This function determines the intercept of the regression line on the Y-axis.
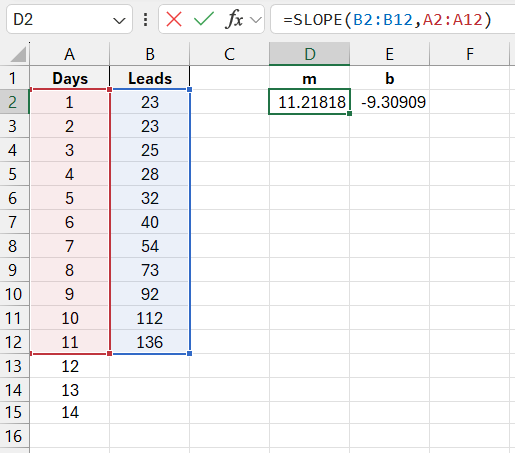
Consider observed numerical data on the number of services provided by a company from the 1st to the 11th of the current month:
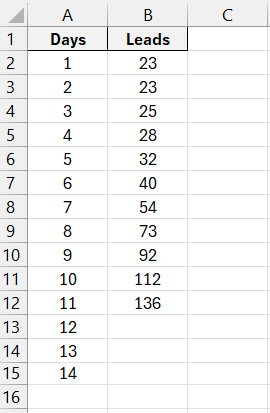
A forecast is needed for the 12th to the 14th.
We derive data series for linear regression using the INTERCEPT function.
! Note: The function itself is not regression. It only determines the necessary regression parameters.
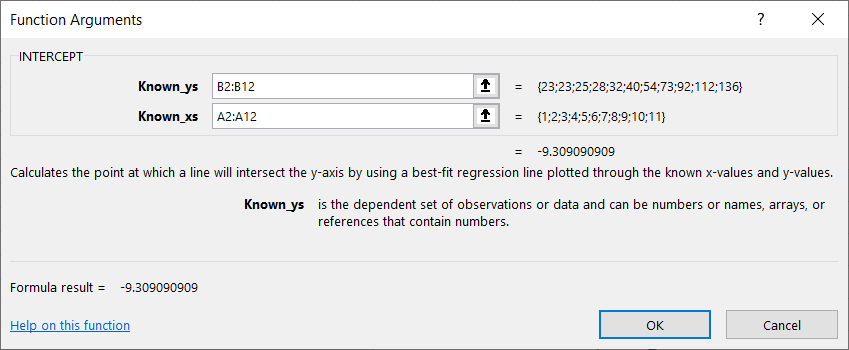
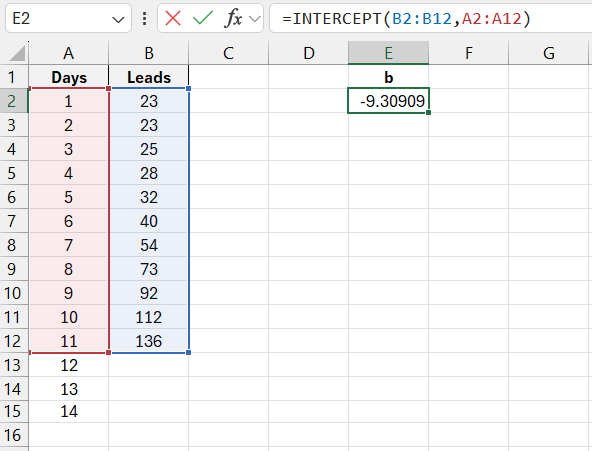
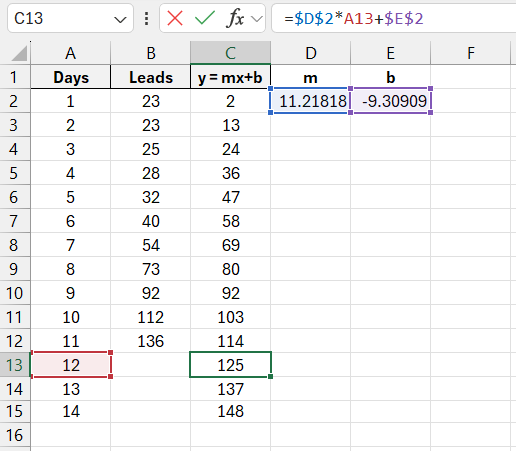
Place the cursor in cell E2 and open the “Function Wizard.” In the “Statistical” category, select the INTERCEPT function. Known y-values: B2:B12. Known x-values: A2:A12.
We obtained the value of the y-intercept (b) in the linear regression equation y = mx + b. To construct the linear regression and achieve the goal, we need to find other unknowns, such as the regression slope (m). Use the built-in SLOPE function.
Fill in the arguments in the same way:
To get the required data series, substitute the known values into the equation:
Download an example of using INTERCEPT function in Excel 
Absolute references to cells D2 and E2 prevent the address from changing when copying the formula. Since the number of services cannot be fractional, set the decimal places to 0 in the “Cell Format” tab for the numerical format.
Advantages of this regression analysis method:
- A straightforward and consistent process for constructing data series using the INTERCEPT (and SLOPE) function.
- A standard method for constructing a trendline.
- The ability to forecast the phenomenon for any desired number of steps forward or backward.
The significant limitation of this method is that the built-in INTERCEPT function only supports linear trendlines. The absence of other types often prevents creating the most realistic forecast or fitting an accurate model for the studied phenomenon.

Data Visualization Charts for Interactive Report Creation in Excel.
Dashboard Templates