Interquartile Range in Excel with QUARTILE Formula Example
In Excel, the QUARTILE function is used to divide data into equal parts. It is also commonly used to identify outliers, which are values that significantly differ from the rest of the data.
Example of Calculating the Interquartile Range for Statistical Analysis in Excel
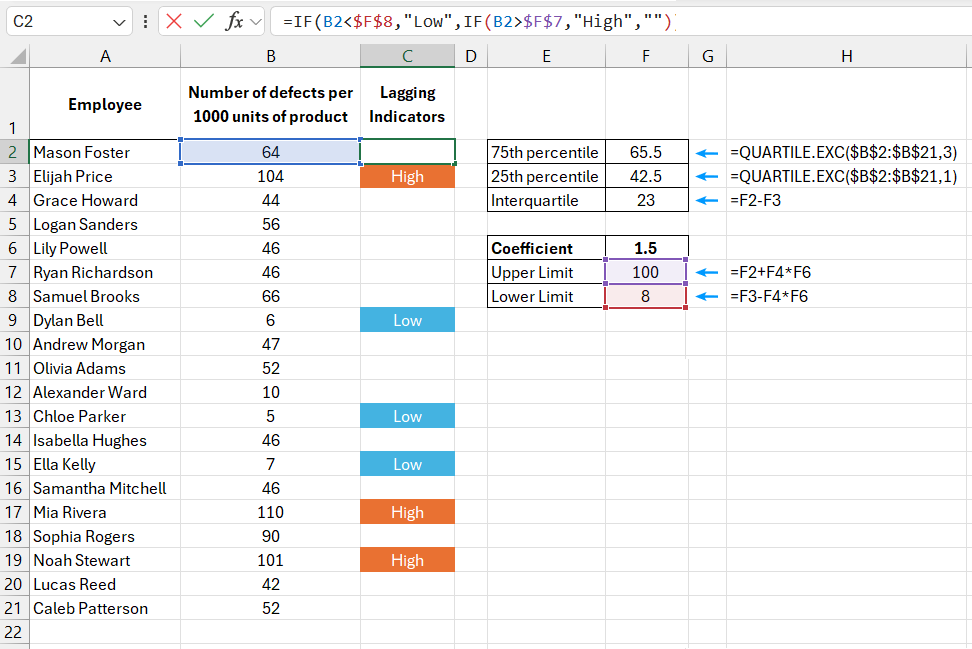
The image below shows another list of employees with defect rates per 1,000 units of produced goods. Let’s assume we need to find out which employees have high or low defect rates, significantly exceeding or falling below the acceptable norm (outliers from the median). To identify such anomalies, we will use the extended interquartile range method in this example. The interquartile range represents the data that lies in the middle 50%, which is between the 75th and 25th percentiles. The term "extended" means that the range can be widened based on a specific coefficient to determine the boundaries. All values outside these boundaries are considered outliers:
=IF(B2<$F$8,"Low",IF(B2>$F$7,"High",""))

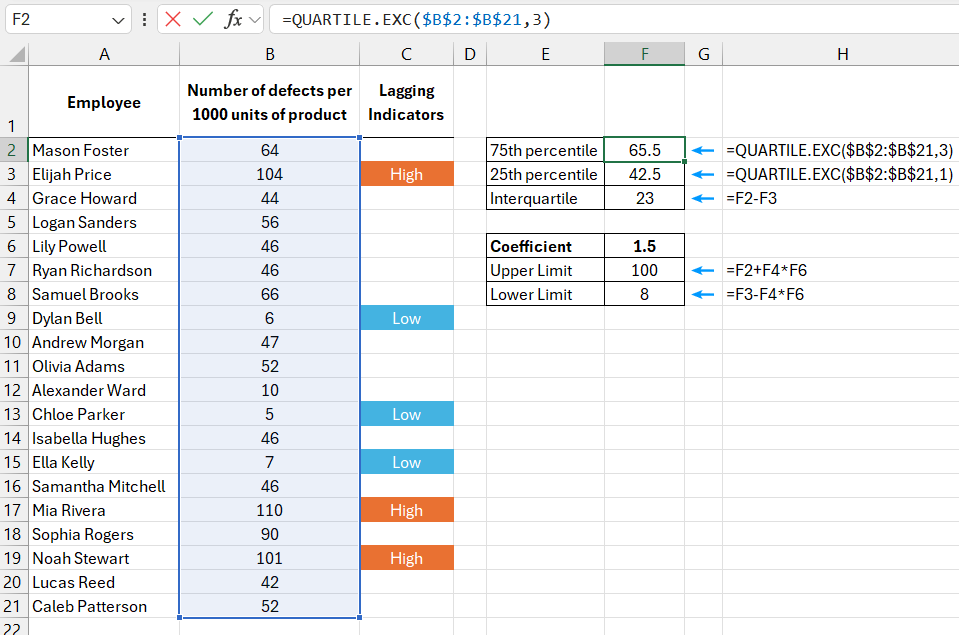
Example of using the quartile formula with exclusion:
=QUARTILE.EXC($B$2:$B$21,3)

To find the middle range between the 75th and 25th percentiles, use the QUARTILE.EXC function with arguments 3 and 1, respectively. The interquartile range is the difference between these values.
In the case of a non-extended interquartile range, to determine the lower boundary, simply subtract the range value from the 25th percentile. For the upper boundary, add it to the 75th percentile. However, this method could result in a large number of outliers. By multiplying the interquartile range by an extension coefficient (set to 1.5 in this example), the boundaries are widened, capturing only extreme values.
Interquartile Range Calculation in Excel
The image below shows the same data from the previous example, sorted by defect rates per 1,000 units of produced goods. For visual clarity, the extended interquartile range boundaries and the upper and lower boundaries of the other quartiles are also marked:

Download example of calculating interquartile range using QUARTILE formula in Excel 
To determine the upper boundary of the interquartile range, multiply the range by the extension coefficient and add the result to the 75th percentile.
To determine the lower boundary, subtract the result of multiplying the range by the coefficient from the 25th percentile.
It may happen that using an extension coefficient of 1.5 excludes values that appear to be outliers or includes values that seem normal. This is not unusual. Simply adjust the coefficient higher or lower if it doesn’t align with your data.
After determining the boundaries, use an IF formula with nested conditions to check whether a value is greater than the upper boundary or less than the lower boundary. If the value significantly deviates (outlier) from the norm, the formula will return "Above" or "Below." If the value lies within the boundaries, the formula will return an empty string ("").
