Agile Sprint Cycle with task update functionality in Excel
When a project rapidly evolves through sprints, it is important to track not only structure but also the actual impact of progress. That impact can be both positive and negative. A dynamic Sprint Cycle chart with a built-in progress scale allows you to monitor stage completion in real time directly while working in Excel.
How the dynamic progress scale works in a Sprint Cycle
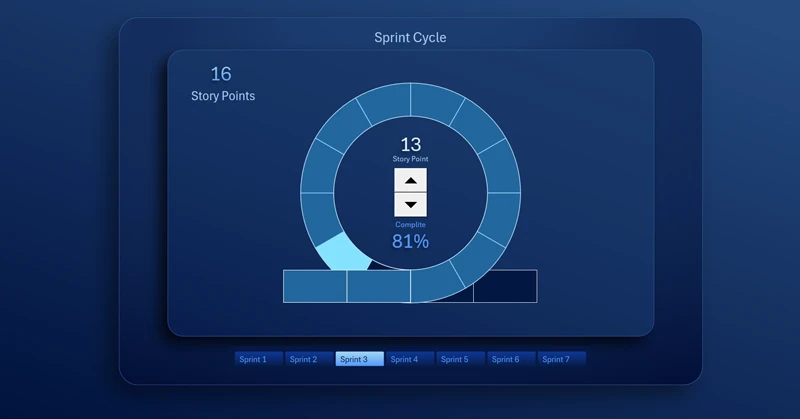
A Sprint Cycle with a progress scale: each segment represents the execution queue of tasks for the current sprint. In Agile project management, it is often necessary to change the number of tasks in a sprint cycle without interrupting ongoing processes. This approach allows the team to optimize efficiency within the project delivery flow. Speed is not everything, but it is often a decisive factor.
How to make an Excel chart dynamically change the number of segments on the fly. This is achieved by using dynamic named ranges in the chart data arguments instead of standard cell references. These named ranges contain special formulas for handling variable data ranges. To master this technique in practice, download the ready-made solution at the end of the article. First, see how this chart can be used to build interactive dashboards.
Sprint Cycle chart in Excel with a dashboard progress scale
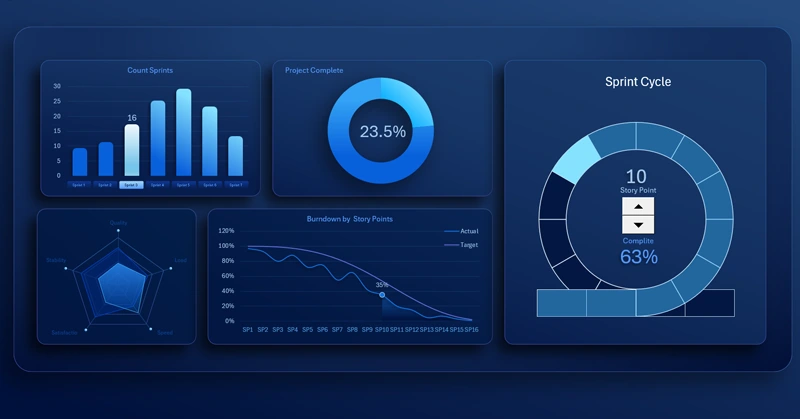
A dynamically adjustable Sprint Cycle with a progress scale transforms static reporting into a live management dashboard. This visualization literally breathes data on the dashboard. The chart helps quickly assess project status, identify deviations, and maintain transparency of Agile team performance at every stage. Visual control of task and stage execution in an Agile project.


Data Visualization Charts for Interactive Report Creation in Excel.
Dashboard Templates