Beautiful and simple interactive Gantt chart in Excel
The Gantt chart is a convenient tool for planning controlled goal achievement, project execution, or simple tasks. In Excel, a Gantt chart can be made interactive, allowing users to manage statistical data relative to time periods easily. This enables users to track progress quickly through visualization of sequentially completed milestones. This comprehensive and versatile format is suitable for any project and makes the process clear at a glance.
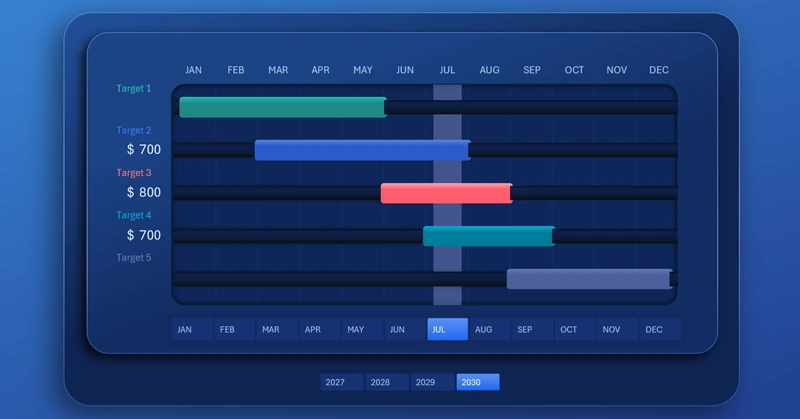
Interactive Gantt Chart Template in Excel
The difficulty of any goal is primarily determined by time! If we had unlimited time, any goal would not be a problem. Any goal is a transformation that requires time. Becoming stronger, healthier, wealthier, or smarter — without a clear timeline, it is impossible to know how many resources we need to invest to achieve it.
Once deadlines are set for the main goal, the necessary time should be divided into sequential tasks, or intermediate goals. Each task requires its own time budget. To consciously control goal achievement, it is important to visualize processes. Excel data visualization helps with this.
Build this simple interactive Gantt chart with a cursor, which will teach you to organize goal achievement processes quickly at a basic level. Decompose a global goal into intermediate goals and tasks. Track progress step by step. Define time budgets. This is a very useful practice, easy to master if you start simple.
For practice, use the ready-made template at the end of the article. For theory, watch the tutorial video. There you will learn:
- Analyze formulas in source tables for data visualization.
- Create a standard horizontal bar chart in Excel.
- Adjust settings and colors for the Gantt chart.
- Add shapes to design the visualization block.
- Edit formulas to create offsets for better design aesthetics.
- Overlay a vertical bar chart to create an interactive cursor.
- Set horizontal axis labels on all charts.
- Add pivot table slicers for interactive control.
- Test the interactive Gantt chart in Excel.
This template is effectively used as a dashboard element. Example:
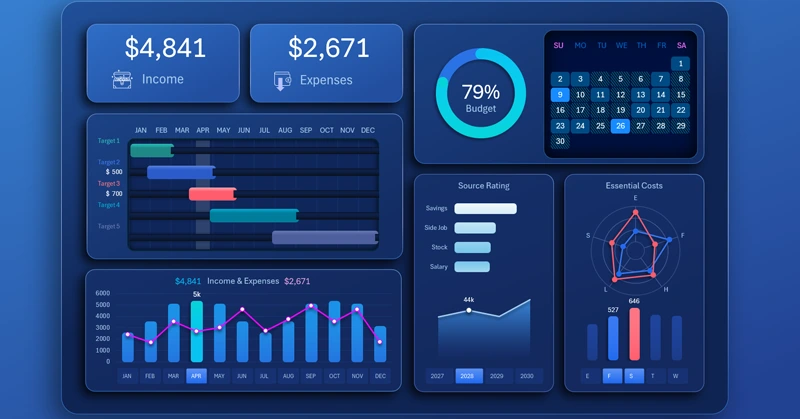
Dashboard for achieving personal financial goals in Excel
An interactive Gantt chart in Excel makes project management visual and convenient. It helps control deadlines, monitor progress, and plan stages without complex tools. Use this approach to improve visualization and increase project work efficiency.


Data Visualization Charts for Interactive Report Creation in Excel.
Dashboard Templates