Chart templates for resource and cost control in Excel
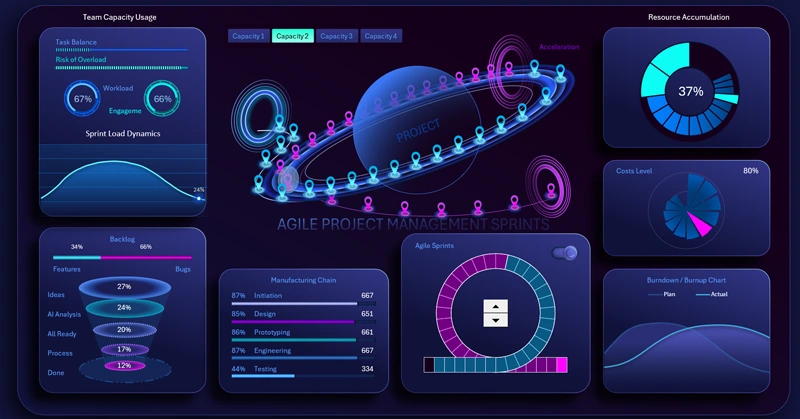
Excel dashboard for analyzing the accumulation of reusable resources, cost control, and task tracking using circular and linear burndown charts. In project management, not only cost control is important, but also the efficient use of resources. This example clearly demonstrates how Excel helps create visual reports on resource consumption.
How to Combine Resource Accumulation and Cost Control in Excel

During project execution, residual resources often arise that can be reused. Excel allows you to visualize such processes using advanced charts, combining resource accumulation analysis, cost dynamics, and task execution into a single analytical system.
A compact multi-chart dashboard is built in Excel. List of charts:
- Resource accumulation pie chart.
- Fan chart of expense levels by reporting periods.
- Interactive line chart for task completion comparative analysis.


The dashboard is designed to visualize planned and actual dynamics of resource consumption and accumulation within a project.
All the charts shown above can be effectively used in large-scale project management dashboards in Excel. Consider this example, where all visualization blocks are described in detail as part of a unified system:
Download an advanced dashboard for agile project management in Excel
Integrating different types of charts in Excel enables the creation of a multi-layered project analysis system. Tracking reusable resources helps reduce costs, the fan chart provides insight into expense structure, and the burndown chart ensures task execution control. This comprehensive approach increases process transparency and supports more accurate decision-making at all stages of project implementation.
 Download chart templates for resource and cost control in Excel

Data Visualization Charts for Interactive Report Creation in Excel.
Dashboard Templates