Compact Excel dashboard for sales analysis in small business
Sales performance analysis is the key to successful small business growth. An Excel dashboard allows you to gather all data in one place and visually track sales dynamics. The dashboard helps evaluate the relationship between two important indicators: market efficiency and product assortment category performance. A manager can identify correlations that most influence sales growth for different product groups. It is especially useful when you need to test a new product line to expand a small business.
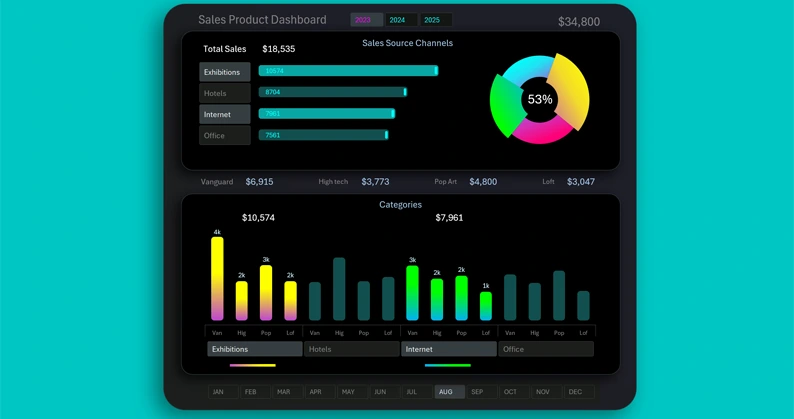
Template of a Mini Dashboard for Sales Testing in Excel
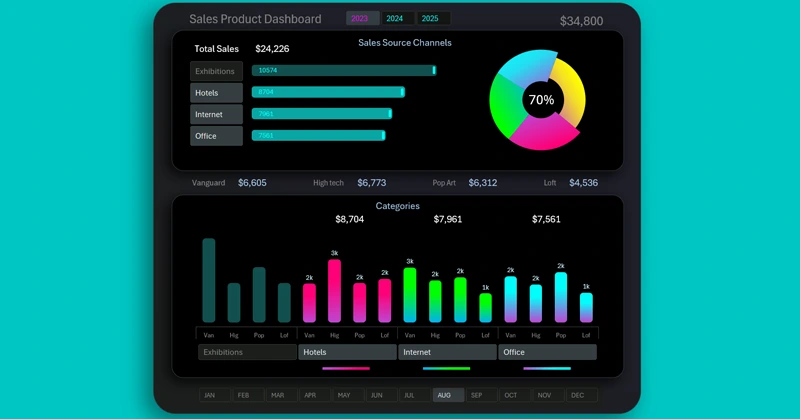
Visualizing sales volumes helps track revenue and risks across different product categories and markets. As a result, it helps make logical and well-grounded decisions for increasing sales and scaling the business.
You can download the dashboard template at the end of the article. But first, review the video tutorial on how to create such dashboards in Excel. Development steps overview:
- Create a dashboard template using shapes with gradients and shadows.
- Define the layout and sizing for the dashboard grid blocks.
- Prepare and format the source data to build a pivot table.
- Create a table of dynamic formulas for interactive data visualization.
- How to create control buttons using pivot table slicers in Excel.
- A horizontal bar chart with a cursor.
- How to create rounded bars on the edges.
- Create a style design for the slicer panel buttons.
- Expand the table with new formulas for an interactive doughnut chart.
- Example of how to create a doughnut chart with a cursor in Excel.
- Apply a new color palette for an attractive and impactful design.
- Use shapes to complete the creative composition of chart design elements.
- A table of dynamic formulas for an interactive bar chart with data grouping.
- Example of how to create a beautiful bar chart with rounded columns.
- Each cursor column should be filled with a separate gradient.
- How to apply button highlighting for a functional panel design.
- Finally, add dynamic data labels linked to Excel formulas.
- Control the dashboard to analyze small business product sales in Excel.
To understand the purpose of each visualization block, we recommend reading the instructions first:
A useful and simple dashboard for quick sales analysis in Excel
Using an Excel dashboard helps small businesses see the full picture, identify trends, and make high-quality decisions. This tool makes management more structured and increases work efficiency, helping you reach financial goals much faster. It makes sales management simple and effective.
Download Compact Excel dashboard for sales analysis in small busines

Data Visualization Charts for Interactive Report Creation in Excel.
Dashboard Templates