3D dashboard for project management in Excel Template
Managing multiple projects in Excel doesn’t have to be confusing. This free downloadable Excel dashboard template will help you organize tasks, track progress, and analyze performance — all in one place.
What’s Inside the Project Management Dashboard Template in Excel
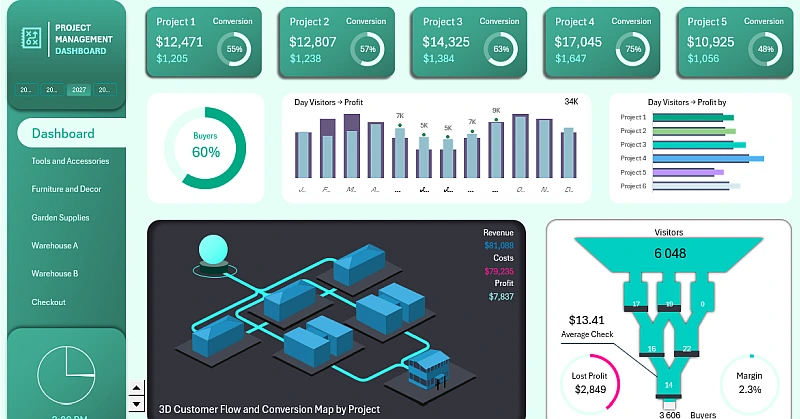
This Excel dashboard is designed for managing projects in a building materials supermarket. It includes:
- A 3D project map visualizing team distribution and activity.
- Dynamic charts for analyzing profit, attendance, and conversion.
- Interactive controls based on slicers and custom forms.
- Animations and isometric graphics created using PowerPoint.
- A sales funnel linked to visitor movement on the map.
- A key performance indicator (KPI) scoreboard for each project.
The template helps you get a helicopter view of all projects, monitor progress, and identify growth opportunities.
You can not only download it but also learn how to create such a dashboard yourself with the video tutorial below, which covers:
- Starting a new project management dashboard with a 3D distribution and conversion map
- Dashboard grid layout for positioning visualization blocks on the Excel sheet
- Using the Processing sheet for tables with formulas for dynamic charts and more
- Processing source data and building pivot tables
- Using pivot table slicers as buttons to control the dashboard in Excel
- Creating initial data visualization elements for the dashboard header
- Designing the interface for refreshing dashboard data
- Chart for presenting visitor-to-buyer conversion rates
- Combined dynamic chart analyzing correlation between profit and visitor count
- Chart analyzing visitor impact on profit for each project
- Using PowerPoint to create isometric graphics in Excel with basic shapes
- Building a 3D map foundation for custom interactive animation visualization in Excel
- Setting up a KPI scoreboard on the 3D project map
- Creating custom animated visualizations using Excel charts and PowerPoint shape editor
- Project design in isometric style in Excel to create 3D effects on the project map
- Isometric project construction made from PowerPoint shapes
- Creating a sales funnel visualization tied to visitor flow animation on the 3D map
- Using vector graphics features to build infographic-style visualizations in Excel
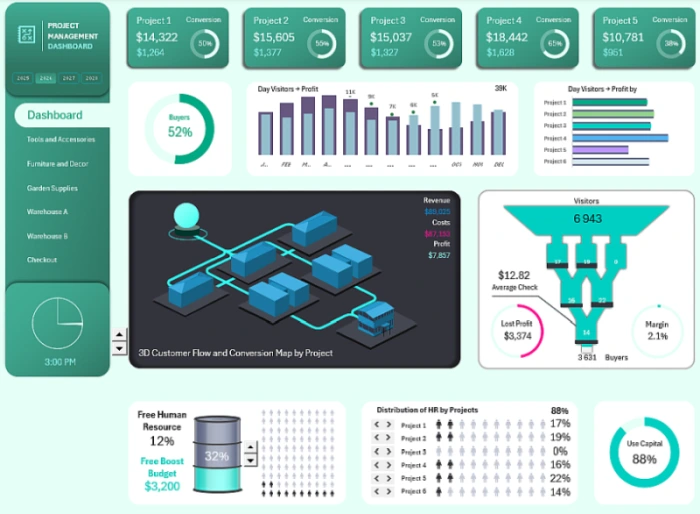
- Example of simple and informative data visualization for Human Resources management using Excel and PowerPoint
- Interactive chart presenting efficient allocation of human resources across projects
- Creating new dashboard screens for in-depth analysis inside each project
- Interactive custom chart for HR distribution across teams within projects
- New visualization block showing team localization and activity levels inside projects
- Creating a glowing cursor effect for an interactive 3D map of visitor flows across projects
- Presentation of an Excel dashboard for project management with impressive interactive custom data visualization
If you want to understand the overall purpose of the dashboard and each visualization block in detail, we recommend reading this article:
3D Dashboard for Project Management in Excel.
Download the template right now to optimize your project workflows, visualize key data points, and present updates clearly and confidently — all without programming or VBA.


Data Visualization Charts for Interactive Report Creation in Excel.
Dashboard Templates