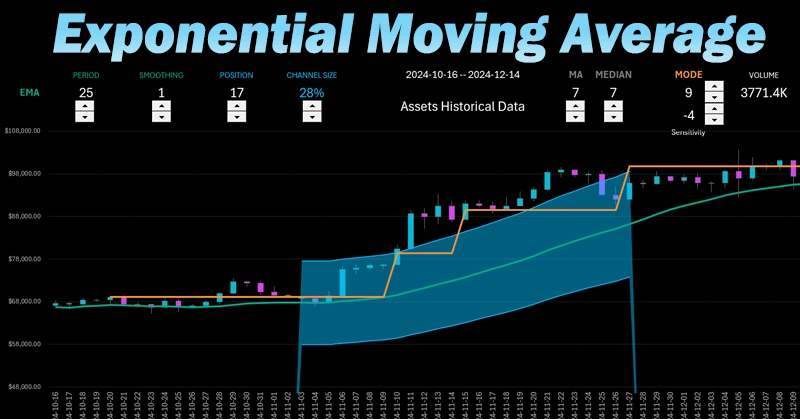
Exponential Moving Average Example in Excel Template
The Exponential Moving Average (EMA) helps identify price trends by giving more weight to recent values. You can create this trendline in Excel without using macros or add-ins. By downloading this example, you'll learn how to manually calculate EMA using a formula and display it on an Excel chart.
The Exponential Moving Average (EMA) helps identify price trends by giving more weight to recent values. You can create this trendline in Excel without using macros or add-ins. By downloading this example, you'll learn how to manually calculate EMA using a formula and display it on an Excel chart.
Exponential Moving Average in Excel
This method requires no special tools – just formulas. Use it to make your data analysis more visual and professional. Watch the video to learn the following aspects:
- Excel formula for auto-filling a table with price movement history of a financial asset.
- Custom cell format code for positive and negative numbers with conditional formatting.
- How to build a bar chart for candlestick price analysis in Excel.
- Setting up a Japanese candlestick chart.
- Formula for building an exponential moving average in Excel.
- How to create a moving average chart for technical price analysis in Excel.
- Adding the first scroll control to view price history on the chart.
- How to build a channel for the exponential moving average in Excel.
- Adding dynamic informative labels for indicator parameters and new control elements for their customization.
- Adding dynamic labels for price and trading volume parameters to the dashboard.
- Formula for the standard moving average indicator algorithm in Excel.
- Adding a custom indicator for price analysis based on the Excel statistical function MEDIAN.
- Excel formula for analyzing market profile using the statistical function MODE on an Excel chart.
- Exploring Excel’s capabilities for visual technical analysis based on the exponential moving average channel indicator.
- Presenting the moving average channel in Excel on Japanese candlestick price bars.
How to write an Excel formula and build a trading channel based on the EMA curve on a candlestick price chart is described in detail here:
Step-by-step guide: How to build an exponential moving average in Excel.
Exponential Moving Average is a powerful tool for price analysis! You can easily create it using Excel formulas without any complexity. By adding EMA to your chart, you'll better track trends and make more informed data-driven decisions.


Data Visualization Charts for Interactive Report Creation in Excel.
Dashboard Templates