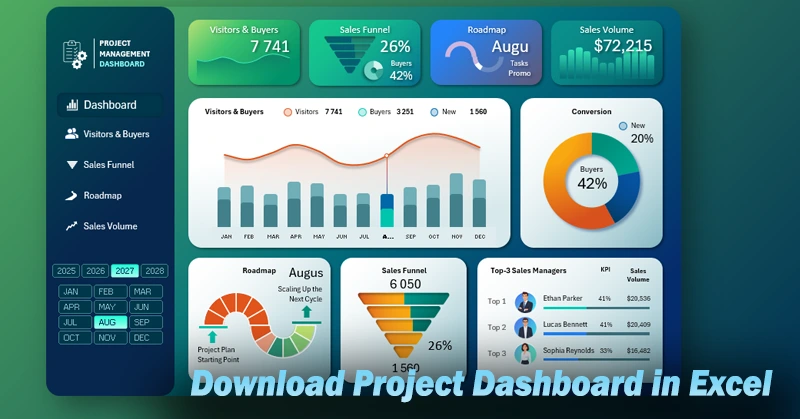
Beautiful Project Management Dashboard in Excel Template
Managing a sales project requires constant monitoring of task completion and adherence to deadlines to achieve financial goals on time. Standard spreadsheets don’t always provide a clear overview. This article presents a visually appealing and functional Excel dashboard that helps clearly track the progress of a sales project. It enables you to manage the process efficiently, respond to deviations promptly, and maintain high team performance.
Excel Dashboard for Sales Project Management
Using a dashboard in Excel makes sales project management more transparent and structured. It helps you quickly assess the current project status, task priorities, and goal completion. Thanks to its visual format, you save time on analysis and improve the efficiency of reaching financial targets. You can also learn to create such dashboards through step-by-step video tutorials that demonstrate:
Part One – Main Screen
- Designer background template for all dashboard screens.
- Creating the dashboard grid for all data visualization blocks.
- Logo and main interface menu.
- Processing raw data and building pivot tables.
- Tables with smart formulas for building interactive charts.
- Creating a visualization to analyze visitor-to-customer conversion.
- Adding and configuring interactive dashboard controls in Excel.
- Example of how to make control panel buttons for an interactive report presentation.
- Donut chart to display visitor conversion rates for the selected month.
- Developing an interactive company growth roadmap in Excel.
- How to create an interactive sales funnel in Excel.
- Using the advanced shape editor in PowerPoint to create striking infographics in Excel.
- Simple yet stylish design for a comparison chart of purchases and sales volume in Excel.
- Sales project management dashboard presentation in Excel.
Part Two – Sub Screens
- Dashboard grid template using Excel shapes – a color palette with harmonious combinations.
- Creating the dashboard logo and menu with Excel icons.
- Processing raw data and setting up pivot tables in Excel.
- Dynamic formula table for building interactive charts.
- Adding slicer controls from pivot tables.
- Combined interactive chart to analyze visitor-to-customer conversion trends.
- Visitor-to-customer conversion summary chart for monthly metrics.
- Top 3 manager ranking – how to create a sales progress bar in Excel.
- Comparison analysis of purchase and sales volumes on one interactive chart.
- Sparklines for KPI cards in the horizontal dashboard header menu.
- Sales funnel screen based on the visitors and customers screen template.
- How to build a 5-level interactive sales funnel to track new visitor-to-customer conversion stages.
- How to use PowerPoint to create complex infographics in Excel.
- Use advanced shape editor tools in PowerPoint—unavailable in Excel—for interactive thumbnails and icons.
- How to switch between screens using the main menu in the Excel dashboard.
- Creating a roadmap screen using the sales funnel screen template.
- How to design stylish interactive roadmap infographics in Excel.
- Building a sales volume screen based on the roadmap screen template.
- Formulas for bar chart analysis of sales volume segmentation by core product categories.
- How to make a structured bar chart with rounded corners in Excel.
- Adding a feature to switch data visualization types in the main block on the same screen.
- Presentation of the analytical capabilities of the functional dashboard design for project management in Excel.
A multi-screen dashboard template requires a detailed user guide:
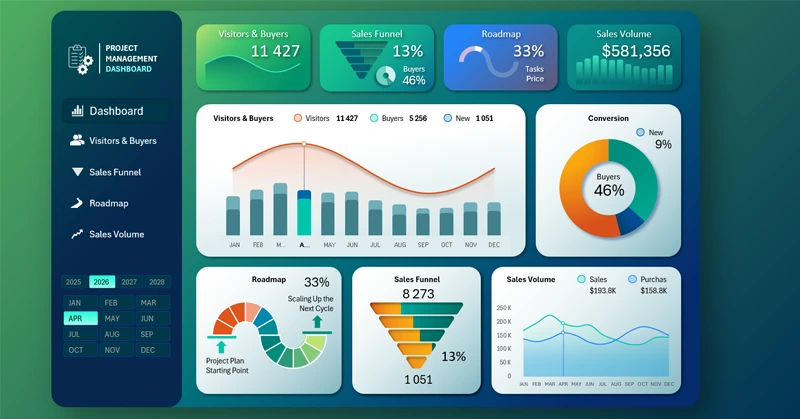
Which data visualization blocks are included in the Excel sales project dashboard
This visually striking yet accessible tool is especially useful for small and medium-sized businesses, where speed and flexibility are essential.


Data Visualization Charts for Interactive Report Creation in Excel.
Dashboard Templates